Category Archives: economic indicator

Personal Economic Well-Being

.. examining characteristics, patterns and change in personal economic well-being; learning about what per capita personal income by county tells us. Per capita personal income (PCPI) is the best single measure of personal economic well-being. PCPI differs American Community Survey (ACS) measure of per capita income, median household income and similar income measures as PCPI includes non-monetary income .. PCPI provides a more comprehensive measure. This post provides an update focused on new data released November 2022, county level personal income time series data starting in 1969.

Patterns of 2021 Per Capita Personal Income by County

.. click graphic for larger view
.. use VDA Web GIS for Web-based interactive viewing/analytics.
.. see this more detailed analytical framework for analytics using VDA Desktop.

Importance of these Data
How is the regional economy doing? How is it trending? What policies might be changed to improve personal economic well-being? Answers to these and similar questions are why knowing about personal income and its derivation, components is important — to residents, businesses and governments. While median household income is often considered the best measure of buying power for an area, it is not the best measure of personal or household economic well-being. PCPI and the Regional Economic Information System provides insights and answers to these questions.

U.S. Change in PCPI
In U.S. metropolitan areas, PCPI increased 7.3 percent in 2021, up from 6.0 percent in 2020. In U.S. nonmetropolitan areas, PCPI increased 7.5 percent, down from 7.9 percent.

Regional Economic Information System
PCPI is a small part of the broader Regional Economic Information System (REIS). The following links show examples of detailed tables for Harris County, TX comparing 2019 and 2021 developed using the ProximityOne REIS package. Develop these profiles for any county for your selected year 1970 through 2021.
  • Personal Income by Major Source
  • Earnings by Source & Sector
  • Employment by Type & Sector
  • Transfer Payments
  • Economic Profile
  • Farm Income & Expenditures

About VDA GIS
VDA Web GIS is a decision-making information resource designed to help stakeholders create and apply insight. Use VDA Web GIS with only a Web browser; nothing to install; GIS experience not required. VDA Web GIS has been developed and is maintained by Warren Glimpse, ProximityOne (Alexandria, VA) and Takashi Hamilton, Tsukasa Consulting (Osaka, Japan).

About the Author
Warren Glimpse is former senior Census Bureau statistician responsible for national scope statistical programs and innovative data access and use operations. He is also the former associate director of the U.S. Office of Federal Statistical Policy and Standards for data access and use. He has more than 20 years of experience in the private sector developing data resources and tools for integration and analysis of geographic, demographic, economic and business data. Join Warren on LinkedIn.

Housing Price Index by ZIP Code – How Housing Markets are Trending

.. housing prices can impact residential investment and affect economic growth, business opportunities and the housing market. The Housing Price Index (HPI) is one measure of how housing prices are changing. The HPI by ZIP code, as reviewed here, is an index based on the year 2000=100. Changing trends in the HPI can used used the determine the relative costs of housing and change in housing valuation. Hosing prices, and the HPI, are only one part of determining how housing markets are trending. Other measures important to examine include building permits and new construction.

Examining Housing Price Trends
Use the VDA Web GIS tool to examine the Housing Price Index for ZIP Codes of interest. Create maps and tabular profiles such as the one shown below.

Video of Steps to Explore HPI by ZIP Code
Click graphic to view video showing how to use VDA Web GIS to access a ZIP Code profile.

About VDA Web GIS
VDA Web GIS is a decision-making information resource designed to help stakeholders create and apply insight. VDA Web GIS has been developed and is maintained by Warren Glimpse, ProximityOne (Alexandria, VA) and Takashi Hamilton, Tsukasa Consulting (Osaka, Japan).

About the Housing Price Index
The Housing Price Index used here is developed by the Federal Housing Fiance Agency (FHFA). The FHFA House Price Index is the nation’s only public, freely available house price indexes that measure changes in single-family home values based on data from all states that extend back to the mid-1970s.

About the Author
Warren Glimpse is former senior Census Bureau statistician responsible for national scope statistical programs and innovative data access and use operations. He is also the former associate director of the U.S. Office of Federal Statistical Policy and Standards for data access and use. He has more than 20 years of experience in the private sector developing data resources and tools for integration and analysis of geographic, demographic, economic and business data. Join Warren on LinkedIn.

New Monthly Residential Construction

.. staying ahead of how and where demographics are changing. Among all monthly new authorized residential construction permit issuing cities/places, Raleigh, NC led the U.S. with 1,749 total units followed by Austin, TX with 1,563 total units in February 2021. See more about this leading economic indicator for cities/places using interactive table below. Data on housing patterns and trends are essential for wide-ranging decision-making applications. Using ProximityOne resources to examine housing characteristics and trends ..

We post monthly and more frequent updates on what New Authorized Residential Construction data are telling us. The March 2021 city/county data will be released this week. Access the latest data for your areas of interest. Click the Follow button at right to keep up-to-date.

Monthly New Authorized Residential Construction
ProximityOne maintains a national monthly time-series database providing access to new authorized residential construction data.  The table presented below summaries key subject matter items available at the city and county level.. These data are one of eleven leading economic indicators. The housing market is often one of the first economic sectors to expand or contract when economic conditions improve or decline. With only a one month lag from reference data to availability date, these measures are early indicators of housing market change. This change typically leads to other types of economic change.

Patterns of New Residential Construction: February 2021; Phoenix Area
Using GIS tools to examine new authorized residential construction .. as an example, the following graphic shows that the City of Phoenix had 1,373 new authorized total units in February 2021. Cities/places shown with black outline.

View Most Month in Tabular Form
Use the interactive table to view these data in a tabular form as shown below.

Scope of Subject Matter
The database is updated monthly and contains monthly and annual data. The scope of subject matter is illustrated as shown below — the number of new units authorized and value by type of structure for Fresno County, CA.

Learn more — Join me in the Data Analytics Web Sessions
Join me in a Accessing & Using GeoDemographics Web Session where we discuss topics relating to measuring and interpreting the where, what, when, how and how much demographic-economic change is occurring and it’s impact.

About the Author
— Warren Glimpse is former senior Census Bureau statistician responsible for national scope statistical programs and innovative data access and use operations. He is also the former associate director of the U.S. Office of Federal Statistical Policy and Standards for data access and use. He has more than 20 years of experience in the private sector developing data resources and tools for integration and analysis of geographic, demographic, economic and business data. Contact Warren. Join Warren on LinkedIn.

Housing Value Appreciation

.. U.S. housing prices rose nationwide in August, up 1.5% from the previous month, based on the FHFA Housing Price Index (HPI). Housing prices rose 8.0% from August 2019 to August 2020.

If you purchased a housing unit in 2019Q2 at $260,200 (the ACS 2019 median housing value), the value of the unit in 2020Q2 would be $271,000, an increase of 4.2%. A good deal in this era of low interest rates.

U.S. housing prices posted a strong increase in August .. the 1.5% increase is the largest one-month price increase observed since the start of the HPI measurement in 1991. This large month-over-month gain contributes to an already strong increase in prices over the summer. These price gains can be attributed to the historically low interest rates, rebounding housing demand and continued supply constraints.

The HPI has various limitations as a measure to assess the housing market. One important limitation is that it a measure in isolation; other related demographic-economic measures are not included. This is unlike the American Community Survey (ACS) estimates of the median housing value ($MHV), used as an annual, year-over-year measure of housing value appreciation.

Median Housing Value
The U.S. ACS 1-year estimate of median housing value ($MHV) increased from $229,700 in 2018 to $240,500 in 2019. The ACS 2020 estimate, which will be impacted by the pandemic, will not be available until September 2021. The ProximityOne 2020 estimate of $MHV is $270,500.

Click this API link to view a CSV-like file showing the 2019 median household income and median housing value by state. Join me in a Data Analytics Web Session (see below) to integrate these data into a map view like shown below. Add other data.

Patterns of Median Housing Value by State

– view developed using ProximityOne CV XE GIS
– click graphic for larger view

An advantage of using the ACS or ACS-like $MHV data is that this measure is synchronized with other related measures, like total population, total housing units, housing units by tenure and age built and so on. Though a popular measure to assess geographically comparable housing values, the $MHV has many limitations. A key limitation is that few survey responders really know the value of their home. Other limitations have to do with the definition itself and how the data are collected/developed. ACS $MHV measures value of only occupied housing units and excludes houses on 10 or more acres and housing units in multi-unit structures. See more. While there are other Federal sources of $MHV, it remains that the usabilty aspects of the ACS or ACS-like measures are second to none.

Learn more — Join me in the Situation & Outlook Web Sessions
Join me in a Situation & Outlook Web Session where we discuss topics relating to measuring and interpreting the where, what, when, how and how much demographic-economic change is occurring and it’s impact.

About the Author
— Warren Glimpse is former senior Census Bureau statistician responsible for national scope statistical programs and innovative data access and use operations. He is also the former associate director of the U.S. Office of Federal Statistical Policy and Standards for data access and use. He has more than 20 years of experience in the private sector developing data resources and tools for integration and analysis of geographic, demographic, economic and business data. Contact Warren. Join Warren on LinkedIn.

Tip of the Day – Examining Median Housing Value – 2020 Update

.. tip of the day .. a continuing weekly or more frequent tip on developing, integrating, accessing and using geographic, demographic, economic and statistical data. Join in .. tip of the day posts are added to the Data Analytics Blog on an irregular basis, normally weekly. Follow the blog to receive updates as they occur.

.. in this era of uncertainly, we ponder the risk and opportunity associated with changing housing value.  Median housing value by ZIP Code area is one metric of great interest to examine levels and change.  While only one measure useful to examine housing characteristics, it is part of a broader set of demographic-economic data that enable analysis of the housing infrastructure and change in a more wholistic manner. How is housing value trending at the neighborhood level in 2020 and beyond? See more about the Situation & Outlook.

.. 5 ways to access/analyze the most recent estimates of median housing value and other subject matter by ZIP Code area .. based on the American Community Survey (ACS) 5-year estimates. See related Web section.

Option 1. View the data as a thematic pattern map
Option 1 is presented as Option 1A (using CV XE GIS) and Option 1B (using Visual Data Analytics VDA Mapserver). See more about GIS.

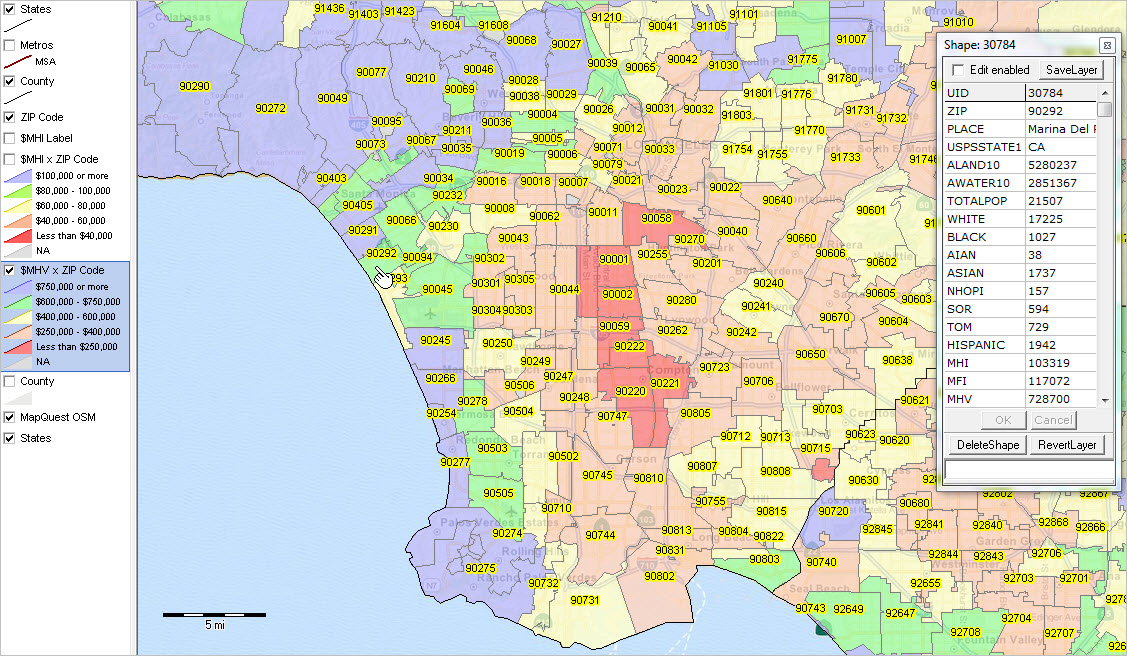
Option 1A. View $MHV as a thematic pattern map; using CV XE GIS:
— Median Housing Value by ZIP Code Area; Los Angeles Area
Click graphic for larger view with more detail.

Click graphic for larger view.
Use the Mapping ZIP Code Demographics resources to develop similar views anywhere in U.S.

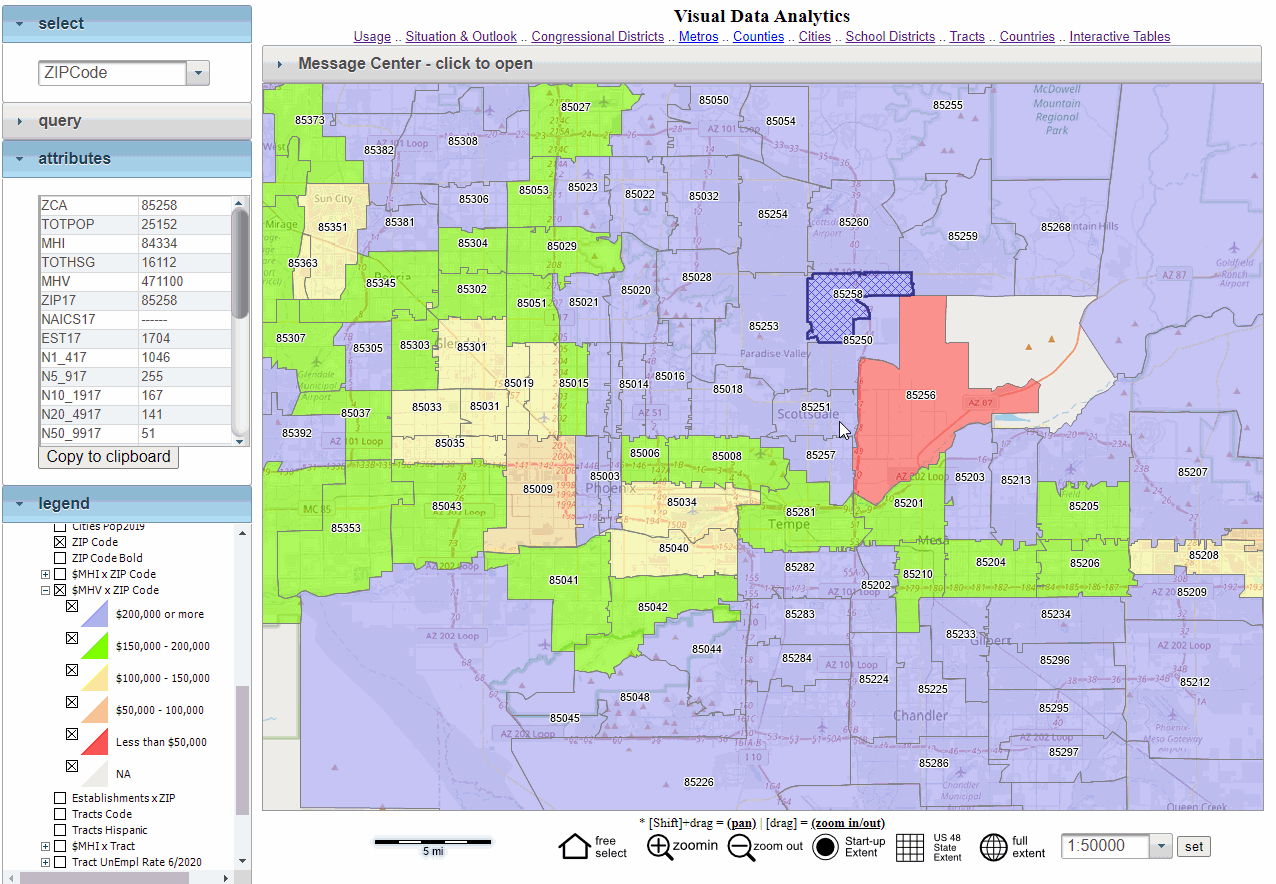
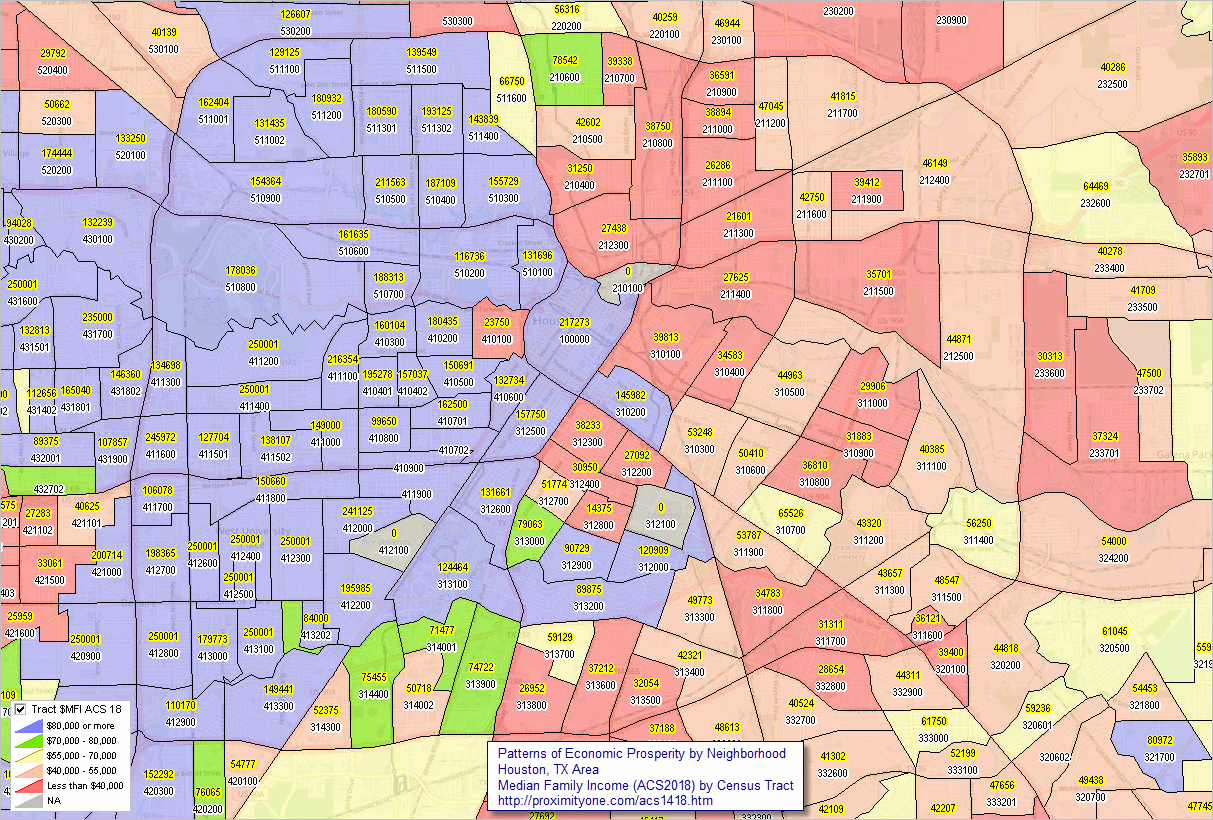
Option 1B. View $MHV (ACS 2018) as a thematic pattern map; using VDA Mapserver:
— Median Housing Value by ZIP Code Area; Phoenix/Scottsdale, AZ area
Click graphic for larger view with more detail.

Click graphic for larger view. Expand window to full screen for best quality view. View features:
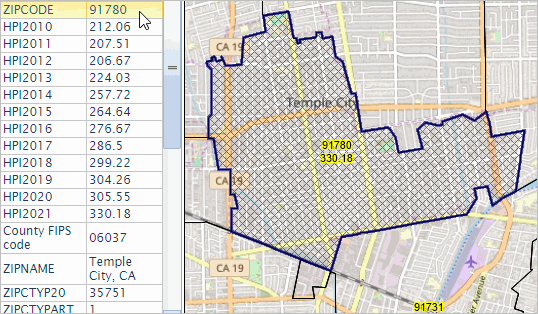
– profile of ZIP 85258 (blue crosshatch highlight) shown in Attributes panel at left
– values-colors shown in Legend panel at left
– transparency setting allows “see through” to view ground topology below.
Use VDA Mapserver: to develop similar views anywhere in U.S. using only a browser. Nothing to install.

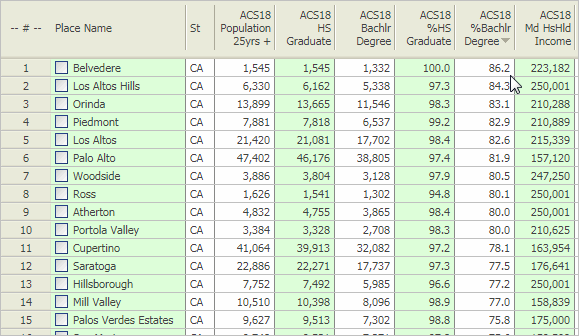
Option 2. Use the interactive table:
– go to http://proximityone.com/zip18dp4.htm (5-year estimates)
– median housing value is item H089; see item list above interactive table.
– scroll left on the table until H089 appears in the header column.
– that column shows the 2018 ACS H089 estimate for for all ZIP codes.
– click column header to sort; click again to sort other direction.
– see usage notes below table.

Option 3. Use the API operation:
– develop file containing $MHV for all ZIP code areas in U.S.
– load into Excel, other software; link with other data.
– median housing value ($MHV) is item B25077_001E.
click this link to get B25077_001E ($MHV) using the API tool.
– this API call retrieves U.S. national scope data.
– a new page displays showing a line/row for each ZIP code.
– median housing value appears on the left, then ZIP code.
– optionally save this file and import the data into a preferred program.
– more about API tools.
Extending option 3 … accessing race, origin and $MHV for each ZIP code …
click on these example APIs to access data for all ZIP codes
.. get extended subject matter for all ZIP codes
.. get extended subject matter for two selected ZIP codes (64112 and 65201)

Items used in these API calls:
.. B01003_001E – Total population
Age
.. B01001_011E — Male: 25 to 29 years (illustrating age cohort access)
.. B01001_035E — Female: 25 to 29 years (illustrating age cohort access)
Race/Origin
.. B02001_002E – White alone
.. B02001_003E – Black or African American alone
.. B02001_004E – American Indian and Alaska Native alone
.. B02001_005E – Asian alone
.. B02001_006E – Native Hawaiian and Other Pacific Islander alone
.. B02001_007E – Some other race alone
.. B02001_008E – Two or more races
.. B03001_003E – Hispanic (of any race)
Income
.. B19013_001E – Median household income ($)
.. B19113_001E – Median family income ($)
Housing & Households
.. B25001_001E – Total housing units
.. B25002_002E – Occupied housing units (households)
.. B19001_017E — Households with household income $200,000 or more
.. B25003_002E — Owner Occupied housing units
.. B25075_023E — Housing units value $500,000 to $749,999
.. B25075_024E — Housing units with value $750,000 to $999,999
.. B25075_025E — Housing units with value $1,000,000 or more
.. B25002_003E – Vacant housing units
.. B25077_001E – Median housing value ($) – owner occupied units
.. B25064_001E – Median gross rent ($) – renter occupied units

View additional subject matter options.

Option 4. View the $MHV in context of other attributes for a ZIP code.
Using – ACS demographic-economic profiles. Example for ZIP 85258:
General Demographics ACS 2018 .. ACS 2017
Social Characteristics ACS 2018 .. ACS 2017
Economic Characteristics ACS 2018 .. ACS 2017
Housing Characteristics ACS 2018 .. ACS 2017 .. $MHV shown in this profile.

Option 5. View 5- and 10-mile circular area profile from ZIP center.
– profile for ZIP 80204 dynamically made using SiteReport tool.
– with SiteReport running, enter the ZIP code, radii and click Run.
– comparative analysis report is generated in HTML and Excel structure.
Click this link to view resulting profile.
– from the profile, site 2 is 1.9 times the population of site 1.
– Site 1 $MHV is $296,998 compared to Site 2 $MHV $269,734.
– GIS view with integrated radius shown below.

This section is focused on median housing value and ZIP code areas. Many other subject matter items will be apparent when these methods are used. Optionally adjust above details to view different subject matter for ZIP codes.

Join me in a Data Analytics Lab session to discuss more details about accessing and using wide-ranging demographic-economic data and data analytics. Learn more about using these data for areas and applications of interest.

About the Author
— Warren Glimpse is former senior Census Bureau statistician responsible for innovative data access and use operations. He is also the former associate director of the U.S. Office of Federal Statistical Policy and Standards for data access and use. He has more than 20 years of experience in the private sector developing data resources and tools for integration and analysis of geographic, demographic, economic and business data. Contact Warren. Join Warren on LinkedIn.

America’s Cities: Situation & Outlook

.. the path forward .. planning for the future .. in April 2019, the employment in Houston, TX was 1,111,283 with an unemployment rate of 3.2%. In April 2020, the employment in Houston, TX was 927,105 with an unemployment rate of 14.9%. What will the 2020 annual look like? 2021? There are many paths to get to 2021 and beyond. What policy and action measures might work best? What about your cities of interest? See the related Web section for more details.

Houston characteristics: Demographic .. Social .. Economic .. Housing
Get for any city/area .. e-mail your request

The pandemic impacts on America’s cities in different ways .. some experiencing little change, others with massive change. When, where and how will these disparate patterns change in cities and communities of interest? How might this change impact you and your community? A comprehensive plan needs to be developed and set in motion to achieve best outcomes. This section provides access to tools and data that stakeholders can use to examine America’s cities demographic-economic characteristics and trends. Examine cities of interest. Use ProximityOne data, tools, methods and advisory services to achieve improved results.

Of the nation’s 327.2 million people, an estimated 206.0 million (62.9%) live within an incorporated place. Of approximately 19,500 incorporated places, about 76 percent had fewer than 5,000 people and nearly 50 percent had fewer than 1,000 people. Examine characteristics of individual city population trends and compare cities in states, regions and peer groups using the interactive table below.

Patterns of Economic Prosperity; Cities 50,000 Population or More
The following view shows cities with 2019 population of 50,000 or more as markers .. mainly principal cities of metropolitan statistical areas (MSAs). Nationally, there are 69 cities with 2019 population of 5,000 or more (determine using interactive table below). The marker color shows the median household income; see inset legend. Click graphic for larger view; expand window to full screen.

– View developed using the ProximityOne CV XE GIS software.

Patterns of Economic Prosperity; Cities 5,000 Population or More
– zoom-in to Dallas Metro
The following view shows cities with 2019 population of 5,000 or more as polygons/city boundary-area in the Dallas metro area. There are 201 cities that intersect with the Dallas metro (code 19100); 96 of these cities have a population greater than 5,000 (determine using interactive table below). The color patterns show the median household income range; see inset legend. Click graphic for larger view; expand window to full screen.

Patterns of Economic Prosperity by Neighborhood & Adjacent Areas
The following view shows patterns of median household income by block group (sub-neighborhoods) within city (bold black boundary) in the Dallas County, TX area. In examining the situation & outlook for a city it is important to examine characteristics of drill-down geography and adjacent cities/areas. Inset legend shows median household income color intervals. Click graphic for larger view; expand window to full screen. In the larger view, a cross-hatch pattern is applied to Dallas city. It is easier to see how Dallas city is comprised of a core area as well as outlying areas and extends into adjacent counties.

Interactive Analysis of Cities: Demographic-Economic Patterns & Trends
Use the interactive table to view, rank, compare cities based on demographic-economic trends and characteristics. The following static graphics provide two examples.


Largest 15 U.S. Cities Ranked on 2019 Population

California Cities Ranked on Educational Attainment

Learn more — Join me in the Situation & Outlook Web Sessions
Join me in a Situation & Outlook Web Session where we discuss topics relating to measuring and interpreting the where, what, when, how and how much demographic-economic change is occurring and it’s impact.

About the Author
— Warren Glimpse is former senior Census Bureau statistician responsible for national scope statistical programs and innovative data access and use operations. He is also the former associate director of the U.S. Office of Federal Statistical Policy and Standards for data access and use. He has more than 20 years of experience in the private sector developing data resources and tools for integration and analysis of geographic, demographic, economic and business data. Contact Warren. Join Warren on LinkedIn.

Analyzing Patterns of COVID-19

.. as COVID-19 impacts our demographics, economy and way of life, we look for answers about where we are and what lies ahead.  Here we review data on COVID-19 incidence and tools to analyze those data. In the coming days, weeks, we plan to augment these tools and data. See more below.  See related Web section for more detail.

Use new resources to examine/analyze patterns of COVID-19 incidence in context of related demographic-economic characteristics. Resources include the narrative/interpretative portion, interactive table and GIS tools and project/files. Data and tools are updated daily. There is no fee to use any of these resources.

COVID-19 Incidence by County in the Atlanta Metro Area
The following graphic shows patterns of COVID-19 incidence (number of cases per 1,000 population) by county. See color patterns in the inset legend. This view shows counties labeled with name and number of confirmed COVID-19 cases. Use the GIS project described below to create variations of this view and develop similar views for any metro.

.. view developed with ProximityOne CV XE GIS and related GIS project.

The GIS resources and interactive table below makes use of the COVID-19 confirmed cases data updated daily by the New York Times. See more about the New York Times U.S. tracking page.

COVID-19 Incidence — U.S. by County
Similar to the above view, the following graphic shows patterns of COVID-19 incidence (number of cases per 1,000 population) by county for the U.S. See color patterns in the inset legend. This view shows counties labeled with name and number of confirmed COVID-19 cases. Use the GIS project described below to create variations of this view and develop similar views for any metro. Click graphic for larger, more detailed view. Expand browser window for best quality view.

.. view developed with ProximityOne CV XE GIS and related GIS project.

Using GIS Tools & Resources
Use the Geographic Information System (GIS) CV XE GIS software and GIS project to view maps and geospatially analyze patterns COVID-19 cases in context of related demographic-economic data. The GIS project automatically opens with the following view:

.. see details about using the mapping/GIS resources.
.. create map views for your areas of interest.

COVID-19 Confirmed Cases by County Interactive Table
Use the interactive table to view, rank, query compare patterns of COVID-19 cases. See related demographic-economic interactive tables.

The following static graphic illustrates use of the table to view daily patterns of COVID-19 cases in Cobb County, GA.

Use the interactive table to examine counties of interest.

Situation & Outlook Web Sessions
Join me in a Situation & Outlook Web Session where we discuss topics relating to measuring and interpreting the where, what, when, how and how much demographic-economic change is occurring and it’s impact.

About the Author
— Warren Glimpse is former senior Census Bureau statistician responsible for innovative data access and use operations. He is also the former associate director of the U.S. Office of Federal Statistical Policy and Standards for data access and use. He has more than 20 years of experience in the private sector developing data resources and tools for integration and analysis of geographic, demographic, economic and business data. Contact Warren. Join Warren on LinkedIn.

Neighborhood Median Family Income: Measuring Economic Well-Being

.. Median Family Income ($MFI) and Median Household Income ($MHI) are two measures of economic well-being. Based on the 2018 American Community Survey 1-year (ACS) data, the U.S. 2018 $MFI was estimated to be $76,401 while the $MHI was estimated to be $61,937 .. both in 2018/current dollars. Create insights into patterns of well-being by neighborhood using geospatial analysis. $MFI patterns are illustrated by the following thematic pattern map.

Patterns of Economic Prosperity by Neighborhood/Census Tract
The following view shows patterns of $MFI by census tract for the inner beltway area of Houston/Harris County, TX. Income interval color patterns are shown in the inset legend. Tracts are labeled with $MFI. Click graphic for larger view. Expand browser window for best quality view. Larger view shows tracts labeled with tract code. It is easy to see how west Houston and east Houston areas differ.

– view developed with ProximityOne CV XE GIS software and related GIS project.
– these $MFI data are based on the 2018 ACS 5-year estimates.

This section focuses on $MFI but could just as well focus on $MHI and yet other related income measures. $MFI will almost always be greater that $MHI, generally by a large margin. See the U.S. 2018 $MFI and $MHI in context of related demographic-economic measure here. See more about the distinctions/definitions of families and and households below.

The ACS data are a unique source of income and related data at the neighborhood or sub-county level. View more about accessing and using the 2018 ACS 5-year estimates.

Family Definition
A family is a group of two people or more (one of whom is the householder) related by birth, marriage, or adoption and residing together; all such people (including related subfamily members) are considered as members of one family. The number of families is equal to the number of family households. However, the count of family members differs from the count of family household members because family household members include any non-relatives living in the household.

Related … an unmarried partner, also known as a domestic partner, is specifically defined as a person who shares a close personal relationship with the reference person. … Same-sex unmarried-partner families or households – reference person and unmarried partner are both male or female.

Household Definition
A household consists of all the people who occupy a housing unit. A house, an apartment or other group of rooms, or a single room, is regarded as a housing unit when it is occupied or intended for occupancy as separate living quarters; that is, when the occupants do not live with any other persons in the structure and there is direct access from the outside or through a common hall.

A household includes the related family members and all the unrelated people, if any, such as lodgers, foster children, wards, or employees who share the housing unit. A person living alone in a housing unit, or a group of unrelated people sharing a housing unit such as partners or roomers, is also counted as a household. The count of households excludes group quarters. There are two major categories of households, “family” and “nonfamily”.

Situation & Outlook Weekly Web Sessions
Join me in a Situation & Outlook web session to discuss more details about demographic-economic estimates and projections.

About the Author
— Warren Glimpse is former senior Census Bureau statistician responsible for innovative data access and use operations. He is also the former associate director of the U.S. Office of Federal Statistical Policy and Standards for data access and use. He has more than 20 years of experience in the private sector developing data resources and tools for integration and analysis of geographic, demographic, economic and business data. Contact Warren. Join Warren on LinkedIn.

Personal Consumption Expenditures by Type & State

.. using Personal Consumption Expenditures (PCE) measures to monitor/examine the strength of a regional economy and consumer buying trends in that region and compare among regions … PCE estimates released in October 2019, show that state personal consumption expenditures increased 5.1 percent in 2018, an acceleration from the 4.4 percent increase in 2017. The percent change in PCE across all states ranged from 7.3 percent in Utah to 3.6 percent in West Virginia.

In 2018, across all states and D.C., per capita PCE was $42,757. Per capita PCE by state ranged from a high of $55,095 (MA) to a low of $31,083 (MS). Per capita PCE in D.C. $63,151. Use the interactive table to example per capita and total PCE by state for 24 categories annually 2010 to 2018.

Per Capita Personal Consumption Expenditures by Category; U.S. 2018
— how does your situation and areas of interest compare to U.S. overall?
— view, sort, query by state and year in the interactive table

Goods and services purchased by people are personal consumption expenditures (PCE). These data provide insights into the strength of a state economy and consumer buying trends. As a major component of GDP, PCE growth has recently accounted for much of the GDP growth. The data reviewed in this section are developed by the Bureau of Economic Analysis (BEA, released each October). ProximityOne develops regional PCE estimates by metro and county. More about PCE.

See related sections:
• State Real Median Household Income
• State Annual Gross Domestic Product by Industry

Per Capita Consumption Expenditures by State, 2018
The following graphic shows patterns of 2018 per capita personal income expenditures (PCE). Intervals show distribution in quintiles, equal number of states per interval. The 2018 U.S. per capita PCE was $42,757. Use CV XE GIS project to examine PCE by types, per cpaita vs total, different years and change. Integrate additional subject matter and types of geography. Click graphic for larger view with details. Expand browser window for bets quality view.

– view developed with ProximityOne CV XE GIS and related GIS project & datasets.

Using the Interactive Table
— which areas have the highest health care expenditures?
Use the interactive table to examine personal consumption expenditures by type and state annually for the period 2010-2018. The following view illustrates use of the table. This view shows use a query to examine only health care expenditures. The table was then sorted in descending order to show the areas with the highest per capita health care expenditures in 2018.

Try using the interactive table to existing states or categories of interest.

Demographic-Economic Analytics Web Sessions
Join me in a Demographics Analytics Lab session to discuss more details about accessing and using wide-ranging demographic-economic data and data analytics. Learn more about using these data for areas and applications of interest.

About the Author
— Warren Glimpse is former senior Census Bureau statistician responsible for innovative data access and use operations. He is also the former associate director of the U.S. Office of Federal Statistical Policy and Standards for data access and use. He has more than 20 years of experience in the private sector developing data resources and tools for integration and analysis of geographic, demographic, economic and business data. Contact Warren. Join Warren on LinkedIn.

U.S. & State Real Median Household Income Trends

.. during the past two years, 2017 and 2018, the real median household income increased by $1,627. Some states experienced a decline in real median household income in the past two years. During the previous two years, 2015 and 2016, the real median household income increased by $3,329. See details in interactive table (opens new page).

Real median household income in the U.S. increased 0.8 percent between the 2017 ACS and 2018 ACS based on the American Community Survey (ACS 2018). The U.S. MHI, based on ACS 2018 (released September 2019), was $61,937. The national MHI has been increasing since 2013. The increase from 2017 is smaller than the prior 3 years, during which MHI increased between 1.8 percent and 3.3 percent annually. This was the second consecutive year that U.S. MHI was higher than 2007.

Household income as used here is the combined gross income of all members of a household, defined as a group of people living together, who are 15 years or older. The median household income is used to examine the economic health of an area or to compare living conditions between geographic regions.

Use the interactive table and related Geographic Information System (GIS) resources to examine income trends and geographic patterns. See details on using GIS project.

Patterns of Real Median Household Income Change; 2016-2018
— change during two calendar years labeled with 2018 real MHI
— click link for larger view; expand browser window for best quality view.

– view developed using ProximityOne CV XE GIS and related GIS project.
– geospatial analyze income characteristics integrated with your data to examine patterns; gain insights.

Median Household Income in the United States: 2005–2018

U.S. & State Median Household Income: Annually 2005–2018 — Interactive Table
The following static graphic illustrates use of the U.S. & State MHI interactive table. This view shows the 10 states/areas ranked on the 2018 real median household income. See pointer, note that D.C. had the highest real 2018 MHI.  

Try it yourself. Use the table to examine different patterns … like which states experienced a decline in a selected year or over a selected period.

Alternative Measures of MHI
There are other ways to measure/estimate MHI. Possibly the most notable alternative is the Census/BLS Current Population Survey (CPS). This topic will be covered in an upcoming blog .. and how ACS and CPS MHI estimates differ. While the CPS can be used to develop state and higher level geography estimates, ACS might be preferred as MHI estimates can also be developed for counties, cities, census tracts and block groups .. and many other political/statistical areas not possible using CPS.

Demographic-Economic Analytics Web Sessions
Join me in a Demographics Analytics Lab session to discuss more details about accessing and using wide-ranging demographic-economic data and data analytics. Learn more about using these data for areas and applications of interest.

About the Author
— Warren Glimpse is former senior Census Bureau statistician responsible for innovative data access and use operations. He is also the former associate director of the U.S. Office of Federal Statistical Policy and Standards for data access and use. He has more than 20 years of experience in the private sector developing data resources and tools for integration and analysis of geographic, demographic, economic and business data. Contact Warren. Join Warren on LinkedIn.