Monthly Archives: August 2019

Using GIS & GeoDemographics

.. join us in the GIS & GeoDemographics self-paced, online course.

Visual representation, maps, of demographic data by geographic area can be exciting and rewarding. Using Geographic Information Systems (GIS) can bring maps alive. Creativity is boundless. The banner at the top of the corresponding Web section presents a static view of a map rendered using GIS. This map shows the Los Angeles area by census tract. For the analyst or stakeholder, it shows something more — the percent Asian citizen voting age population by tract, overlayed with Congressional District boundaries and codes. It shows relationships, patterns. Using the power of GIS, the zoom level, colors, legend, and labeling can all be changed immediately. You, the GIS user, are at once analyst, artist and storyteller. In control of your medium, canvas, you further your benefits from use these software and data by making dynamic presentations in collaborations. Make compelling arguments. Capture your views and blend them with words and charts into documents. Welcome to the world of GIS and geodemographics.

Mapping census block demographics
The graphic shown below illustrates use of GIS software with the TIGER digital map database census block shapefile to show census blocks for two Ohio counties in context of 2018 CBSAs/Metros. Clicking on a census block (see pointer) shows a mini profile for that block.


– view developed using ProximityOne CV XE GIS and related GIS project.

Using GIS & GeoDemographics .. about the course
Examining geographic-demographic-economic characteristics, patterns and trends … researchers, policymakers, journalists, administrators, students among others. How can you most benefit from using the TIGER geographic data to meet your objectives? These data are available at no cost. Join us in the Using GIS Tools & GeoDemographics online, self-paced course. Learn all aspects of using the Census Bureau TIGER files and related Census-sourced and other Federal statistical data. Augment your professional skills; participants receive all required data, methods and tools. Your personal session is developed and coordinated by Warren Glimpse. You receive the GIS course certificate upon completion. The course may be started at any time and includes requisite Windows-based CV XE GIS software. The course assumes the participant has basic familiarity with a Windows computer, Internet and spreadsheet operations. No GIS related experience is required. Experienced GIS professionals also benefit by learning about the use and nuances of Census-sourced data and integrating these with other data. The structure includes four segments that typically require 2.5 hours each. It is feasible to complete the course in a day or two though we suggest two weeks.

Use Geographic Information Systems (GIS) with TIGER … integrate/analyze data from American Community Survey (ACS) or the decennial census (Census 2010) (Census 2020) into TIGER files to make thematic maps. Merge data from other statistical programs. Geocode your address-based data and add the geocoded data to a GIS project/map view; examine patterns. View your market/service areas and assess competitive position, unmet opportunities. Learn about procedures and strategies to develop GIS projects that meet your needs. Acquire the tools and data to perform these tasks without spending more — provided as a part of our course.

The course is not just about TIGER and demographic-economic data. It provides a well-rounded framework for how to use GIS. While TIGER is a focus, we review procedures to access and use thousands of public use shapefiles and GIS files that may be useful to you. It provides a well-rounded framework for how to use GIS.

Enroll today …
Click the enrollment button/link (opens new page) to enroll now ($395). We will contact you and provide next step information.   Questions? Call us at (800)364-7656.

Data Analytics Web Sessions
Join me in a Demographics Analytics Lab session to discuss more details about accessing and using wide-ranging demographic-economic data and data analytics. Learn more about using these data for areas and applications of interest.

About the Author
— Warren Glimpse is former senior Census Bureau statistician responsible for innovative data access and use operations. He is also the former associate director of the U.S. Office of Federal Statistical Policy and Standards for data access and use. He has more than 20 years of experience in the private sector developing data resources and tools for integration and analysis of geographic, demographic, economic and business data. Contact Warren. Join Warren on LinkedIn.

The Local Area Monthly Employment Situation

.. in June 2019, the local area unemployment rate ranged from 1.3% (Lyon County, IA) to 19.6% (Yuma County, AZ) among the lower 48 states. 133 counties had an unemployment rate of 7% or more during June 2018 through June 2019. Over the past year, as shown in the this interactive table, the unemployment rate has generally decreased among all counties. We track the local area employment situation historically and develop alternative scenario projections. See the related Web page for more information.

Patterns of Unemployment Rate by County
The following graphic shows patterns of the estimated June 2019 unemployment rate by county. Use the GIS tools and data to develop variations of this view optionally integrated with other data. Click graphic for larger view. Expand browser window for best quality view.

— view created using the ProximityOne CV XE GIS and associated GIS Project

Examine Areas of Interest
This graphic illustrates the monthly over the year employment situation for the Houston, TX metro using the interactive table.

Click graphic for larger view.

Create a similar table for any metro:
Open the interactive table (green and white table midway down).
Click ShowAll button below table.
Key in a 5-character metro code in edit box at right of FindCBSACode.
    … get from scroll list at upper right of table.
    … e.g., 19100 for Dallas, TX metro.
Click FindCBSACode; table refreshes showing only counties in this metro.
Click Current Situation button below table; table refreshes with selected columns.
Click the Pop2018 column header cell twice to rank-order the columns.
Done .. try these steps for an area of interest.

Demographic-Economic Analytics Web Sessions
Join me in a Demographics Analytics Lab session to discuss more details about accessing and using wide-ranging demographic-economic data and data analytics. Learn more about using these data for areas and applications of interest.

About the Author
— Warren Glimpse is former senior Census Bureau statistician responsible for innovative data access and use operations. He is also the former associate director of the U.S. Office of Federal Statistical Policy and Standards for data access and use. He has more than 20 years of experience in the private sector developing data resources and tools for integration and analysis of geographic, demographic, economic and business data. Contact Warren. Join Warren on LinkedIn.

Visualizing Metro Area Geography

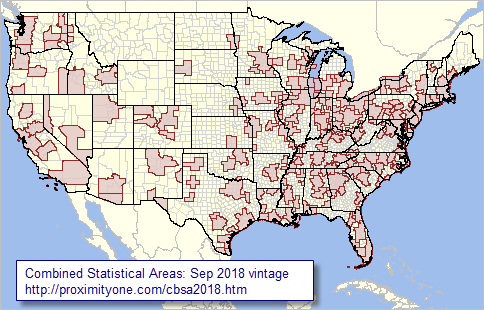
.. metropolitan areas are referred to as CBSAs (Core-Based Statistical Areas) and formally defined as sets of contiguous counties for the Federal Statistical System by OMB based largely on Census Bureau data.  More than 93-percent of the U.S. population live in CBSAs. This post presents three map graphics showing the geographic configuration of CBSAs and related CSAs (Combined Statistical Areas) — groupings of contiguous CBSAs that meet certain criteria. See related Web section for more detail.

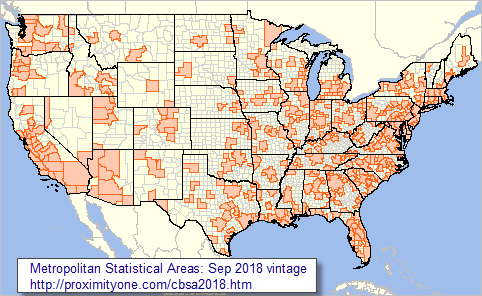
The graphics below use the September 2018 CBSA vintage, the current and likely to be used for Census 2020 tabulations. These CBSAs are comprised of 392 Metropolitan Statistical Areas (MSAs), 384 MSAs in the U.S. and 8 in Puerto Rico, and 546 Micropolitan Statistical Areas (MISAs), 542 in the U.S. and 4 in Puerto Rico. For those MSAs that qualify, 11 MSAs are subdivided into 31 Metropolitan Divisions (MDs).

Metro Demographic-Economic Insights. What are the demographic characteristics of metros, how are they changing? We have developed annual population and population components of change estimates for the September 2018 vintage CBSAs.  Access these data in this interactive table. View CBSA county components. These data are integrated with other data to develop wide-ranging demographic-economic current estimates and projections for CBSAs and other geography (Situation & Outlook).

Metropolitan Statistical Areas, Sep 2018 Vintage
The following graphic shows the 2018 vintage Metropolitan Statistical Areas (MSAs). Use the associated GIS project to examine different years or subject matter items. Click graphic for larger view showing combined MSAs and MISAs.
Expand browser window for best quality view.


.. view developed with ProximityOne CV XE GIS and related GIS project.
.. create other views, geospatially analyze your data with associated GIS project.

Micropolitan Statistical Areas, Sep 2018 Vintage
The following graphic shows the 2018 vintage Micropolitan Statistical Areas (MISAs). Use the associated GIS project to examine different years or subject matter items. Click graphic for larger view showing combined MSAs and MISAs. Expand browser window for best quality view.


.. view developed with ProximityOne CV XE GIS and related GIS project.
.. create other views, geospatially analyze your data with associated GIS project.

Combined Statistical Areas, Sep 2018 Vintage
The following graphic shows the 2018 vintage Combined Statistical Areas (CSAs).
CSAs are contiguous CBSAs that are combined to form a CSA when certain conditions are met. Use the associated GIS project to examine different years or subject matter items. Click graphic for larger view showing CSAs with county overlay (visually determining which counties are in a CSA). Expand browser window for best quality view.


.. view developed with ProximityOne CV XE GIS and related GIS project.
.. create other views, geospatially analyze your data with associated GIS project.

DemographicEconomic Analytics Web Sessions
Join me in a Demographics Analytics Lab session to discuss more details about accessing and using wide-ranging demographic-economic data and data analytics. Learn more about using these data for areas and applications of interest.

About the Author
— Warren Glimpse is former senior Census Bureau statistician responsible for innovative data access and use operations. He is also the former associate director of the U.S. Office of Federal Statistical Policy and Standards for data access and use. He has more than 20 years of experience in the private sector developing data resources and tools for integration and analysis of geographic, demographic, economic and business data. Contact Warren. Join Warren on LinkedIn.
Census Tract Demographic-Economic Characteristics & Trends

..  Census tract demographics are used in wide-ranging public and private sector applications to examine patterns and characteristics of sub-county areas. Tract level data from Census 2000Census 2010 and the American Community Survey (ACS) can be used to analyze trade/market areas, neighborhoods and other small area study areas. But what about more current data and trends since 2010? What about business establishment data and other subject matter not included in either the census or ACS data?

There are no current demographic-economic census tract data available from the Census Bureau or other Federal statistical programs. Annually released ACS 5-year estimates are available by census tract but are for 5-year periods and dated. The most recent census tract level ACS data are based on the ACS 2017 5-year estimates (ACS 1317). Those data are not for the year 2017 but estimates for ACS survey respondents for the 5 year period 2013-2017; centric to mid-2015.

Patterns of Median Household Income %Change by Census Tract
The graphic below shows patterns of economic prosperity change based on median household income percent change ACS 2012 to ACS 2017 by tract in the Dallas metro area.

– view developed using ProximityOne CV XE GIS and related GIS project.

Using the Interactive Table
Use the interactive table .. click this link .. to view, query, rank, compare selected characteristics of the population, housing, educational attainment and income for census tracts based on ACS 2012 5-year, and ACS 2017 5-year data. Hundreds of additional items are available. See about related census tract data resources and applications.

Try it yourself ..
Tracts with ACS 2017 population 3,500-4,500 ranked on change in $MHI:
Replicate the following graphic using the interactive table. This view was produced by clicking the Pop17 button below the table to select only tracts with a ACS 2017 population between 3,500 and 4,500. Then the $MHI columns button was clicked to view only selected columns. Finally the qualifying tracts were sorted in descending order by clicking the $MHI Change column header cell.

Based on these estimates, tract 04013105004 in Maricopa County, AZ is top ranked, where the $MHI increased by $97,723 from the ACS 2012 5-year period to the ACS 2017 5-year period.

Corresponding API calls to access the $MHI for this tract (click links to access data):
ACS 2012 $MHIACS 2017 $MHI
Join us in an upcoming Data Analytics Web Session (see below) to learn more about using APIs to access these data and similar data.

Access more detailed ACS 2017 tract interactive tables:
  General demographics .. Social .. Economic .. Housing

Demographic Analytics Web Sessions
Join me in a Demographics Analytics Lab session to discuss more details about accessing and using wide-ranging demographic-economic data and data analytics. Learn more about using these data for areas and applications of interest.

About the Author
— Warren Glimpse is former senior Census Bureau statistician responsible for innovative data access and use operations. He is also the former associate director of the U.S. Office of Federal Statistical Policy and Standards for data access and use. He has more than 20 years of experience in the private sector developing data resources and tools for integration and analysis of geographic, demographic, economic and business data. Contact Warren. Join Warren on LinkedIn.