Monthly Archives: July 2015

2015 Metropolitan Statistical Area Updates

.. new metropolitan statistical area designations are important; they identify transitioning and growing counties reaching a certain plateau of demographic-economic well-being. In July 2015, sixteen new Micropolitan Statistical Areas (MISAs) were designated, reflecting population growth through 2014. At the same time one MISA changed status to a Metropolitan Statistical Area (MSA) — Enid, OK. The five new Combined Statistical Areas (CSAs) reflect continuing urban agglomeration evolvement as contiguous metros grow and join adjacent metros. How will these new metros change by 2020? 2060? relate to others? See more detail in this related Web pages.

Core-Based Statistical Areas (CBSAs — the collective set of MSAs and MISAs) designations are updated from periodically based on changing demographic-economic conditions. The July 2015 CBSA designations, summarized here, update the previous February 2013 CBSA designations. CBSAs are comprised of one or more contiguous counties. CBSA designations are made by OMB based primarily on Census Bureau data.

There are now 945 CBSAs (MSAs and MISAs) in the U.S. and Puerto Rico.
• 389 MSAs (382 in the United States and 7 in Puerto Rico).
  .. 11 MSAs contain a total of 31 Metropolitan Divisions (MDs).
• 556 MISAs (551 in the U.S. and 5 in Puerto Rico).
174 Combined Statistical Areas (CSAs) now exist with a total of 537 component MSAs and MISAs.

Updates provided here are based on 2010 standards for delineating MSAs and MISAs. The updates reflect changes based on Census Bureau population estimates for July 1, 2012 and July 1, 2013.

The 2015 changes include:
• designation of a new metropolitan statistical area
• sixteen new micropolitan statistical areas
• five new combined statistical areas
• new components of existing combined statistical areas
• other changes

Examining Demographic Change for Metros & Components
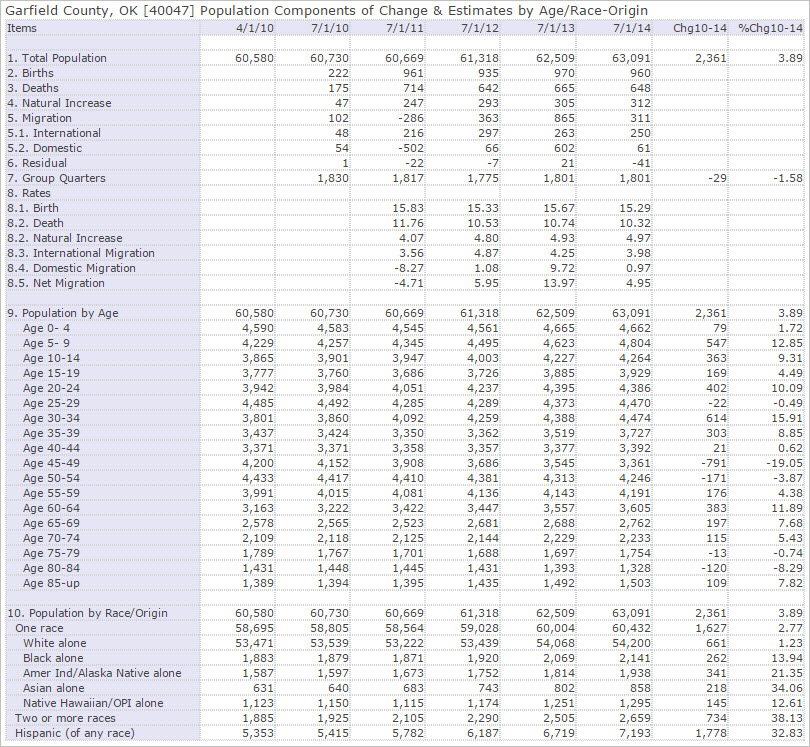
In the list that follows, the MSA or MISA 5-digit geocode/geoid, uniquely identifying this metro/CBSA among all others, appears following the MSA or MISA name. Click county code link, following county name, to view a demographic trend profile. Click graphic below to view the illustrative profile for Garfield County, OK (Enid, OK MSA).

View county demographic change in context of other counties using this interactive table. View characteristics of principal cities in context of other cities using this interactive table.

New Metropolitan Statistical Area & County
Enid, OK MSA (21420) — previously a MISA that now qualifies as a new MSA
  Garfield County (40047)

New Micropolitan Statistical Areas (MISA) & County Components
Alexander City, AL MISA (10760)
  Tallapoosa County (01123)
Atmore, AL MISA (12120)
  Escambia County (12033)
Bonham, TX MISA (14300)
  Fannin County (13111)
Brownsville, TN MISA (15140)
  Haywood County (47075)
Carroll, IA MISA (16140)
  Carroll County (19027)
Central City, KY MISA (16420)
  Muhlenberg County (21177)
Eufaula, AL-GA MISA (21640)
  Barbour County, AL (01005); Quitman County, GA (13239)
Fairmont, MN (21860 MISA)
  Martin County (27091)
Fort Payne, AL MISA (22840)
  DeKalb County (01049)
Grand Rapids, MN MISA (24330)
  Itasca County (27061)
Hope, AR MISA (26260)
  Hempstead County, (05057) Nevada County (05099)
Jennings, LA MISA (27660)
  Jefferson Davis Parish (22053)
Pella, IA MISA (37800)
  Marion County (19125)
Ruidoso, NM MISA (40760)
  Lincoln County (35027)
St. Marys, PA MISA (41260)
  Elk County (42047)
West Point, MS MISA (48500)
  Clay County (28025)

New Combined Statistical Areas (CSA) and Components
Columbus-West Point, MS CSA (200)
  Columbus, MS MISA
  West Point, MS MISA
Jackson-Brownsville, TN CSA (297)
  Brownsville, TN MISA
  Jackson, TN MSA
Lake Charles-Jennings, LA CSA (324)
  Jennings, LA MISA
  Lake Charles, LA MSA
Oskaloosa-Pella, lA CSA (423)
  Oskaloosa, lA MISA
  Pella, lA MISA
Pensacola-Ferry Pass, FL-AL CSA (426)
  Atmore, AL MISA
  Pensacola-Ferry Pass-Brent, FL MSA

New Components of Existing Combined Statistical Areas (CSA)
  Alexander City, AL MISA added to Birmingham-Hoover-Talladega, AL CSA (142).
  Bonham, TX MISA added to Dallas-Fort Worth, TX-OK CSA (206).
  Fort Payne, AL MISA added to Huntsville-Decatur-Albertville, AL CSA (290).

About the Author
— Warren Glimpse is former senior Census Bureau statistician responsible for innovative data access and use operations. He is also the former associate director of the U.S. Office of Federal Statistical Policy and Standards for data access and use. He has more than 20 years of experience in the private sector developing data resources and tools for integration and analysis of geographic, demographic, economic and business data.

Navigating the U.S. Federal Statistical System

..  the U.S. Federal Statistical System offers a vast array of diverse data resources that are useful in wide-ranging planning and analytical applications. Many of these data resources, such as census block level demographics from the decennial census, are unique in scope and content; in many cases there are no alternative data resources.

But there are issues/challenges for the data user to navigate the Federal Statistical System. Examples … the Bureau of Labor Statistics releases total employment data by county quarterly and monthly through multiple programs. The data values differ, for methodological reasons, but the net result can be confusion. The Census Bureau releases total employment data from many statistical programs by county both annually and more frequently. Where are these alternative total employment data and how can they be accessed? How do these various measures differ and which data are right for my situation? This section provides basic statistical program information. Subsequent updates will provide more detail. See the related Web section for more information.

Navigating the U.S. Federal Statistical System
  — click to view agencies, programs, data.

This section provides an overview of the U.S. Federal Statistical System (FSS) and information that can help stakeholders navigate access to selected types of data produced by the FSS. While the FSS is focused on agencies that collect, develop and make available statistical data, there is a broader set of data and resources that relate to accessing and using these data. As technology and related data analytics resources have evolved, access to and use of these data is closely associated with the development of geographic data by Federal statistical and other agencies and Geographic Information Systems (GIS).

The FSS is a decentralized set of agencies that collect, develop and make available statistical and geographic data. The OMB Office of Statistical Programs and Standards (SPS) provides a FSS coordinative role. The SPS establishes statistical policies and standards, identifies priorities for improving programs, evaluates statistical agency budgets, reviews and approves Federal agency information collections involving statistical methods, and coordinates U.S. participation in international statistical activities.

While the FSS spans more than 100 agencies, the 13 “principal statistical agencies” have statistical work as their principal mission. Excluding funding for the decennial census ($689.0 million requested for the decennial census for FY 2015), approximately 38 percent ($2,378.8 million of the $6,310.8 million total proposed for FY 2015 President’s budget request) of overall funding for Federal statistical activities (of the Executive Branch) provides resources for these 13 agencies. The principal statistical agencies include:
Census Bureau (Commerce)
Bureau of Economic Analysis (Commerce)
Bureau of Justice Statistics (Justice)
Bureau of Labor Statistics (Labor)
Bureau of Transportation Statistics (Transporation)
Economic Research Service (Agriculture)
Energy Information Administration (Energy)
National Agricultural Statistics Service (Agriculture)
National Center for Education Statistics (Education)
National Center for Health Statistics (CDC/HHS)
National Center for Science and Engineering Statistics — NSF/Independent
Office of Research, Evaluation, and Statistics — SSA/Independent
Statistics of Income (IRS)

While the above agencies are classified as the “principal statistical agencies”, there are many other agencies that produce statistics that might be as much or more relevant to your needs. See this table that lists statistical programs and resources organized by producing agency.

New and updated Federal statistical data evolve daily. The Navigating the U.S. Federal Statistical System resource is frequently updated.

About the Author
— Warren Glimpse is former senior Census Bureau statistician responsible for innovative data access and use operations. He is also the former associate director of the U.S. Office of Federal Statistical Policy and Standards for data access and use. He has more than 20 years of experience in the private sector developing data resources and tools for integration and analysis of geographic, demographic, economic and business data.

New York City: Census Block Demographics

.. census blocks are the smallest geographic areas for which decennial census data (and data from any Federal statistical program) are tabulated. Census blocks are geographically defined by the Census Bureau in coordination with local agencies. For Census 2010, there were a total of 11,078,297 census blocks covering the U.S. wall-to-wall. 541,776 of these blocks are water blocks, mainly located in coastal areas. Approximately one-third of all census blocks have zero population. See more about accessing and using census block demographics in this related Web section

Related New York City posts:
Manhattan Financial Sector Earnings – monthly/quarterly attributes
    .. examine establishment characteristics by type of business
        for any New York City borough or the metro
NYC Chelsea area and demographic analysis
Patterns of Block Group Income Inequality
    .. illustrative applications in Pelham, NY vicinity; north of NYC & NYC overall

Census block data are important to demographic/market analysis in part due to the data being counts of population and housing units rather than estimates (subject to errors of estimation). Block data are also important due to their geographic granularity, very detailed geography. Block data provide a good way to aggregate small area demographics into territories, markets and service areas using GIS tools. We have not only demographic data for blocks but also their geographic attributes: location/boundary and area. Make maps and perform geospatial analysis using census block shapefiles. Use census block geography with non-census data for wide-ranging analyses.

Largest Population New York City (NYC) Census Blocks
The following graphic shows the NYC Census 2010 census block having the largest Census 2010 population that is not a group quarters population block.
The Lincoln Center census block shown in the graphic (red boundary) has 4,067 population and 2,922 housing units.

– click graphic for larger view; view developed using CV XE GIS

This block (36 061 015500 6000) occupies 0.033 square miles. It has a population density of 122,333 (population per square mile).

The NYC block with the largest population is on Rikers Island and has a group quarters population of 8,634 and 0 housing units.

For Census 2010, there were 350,169 census blocks covering the state of New York; 13,356 census blocks were water blocks. For the State of New York, as of Census 2010 the average census block population was 55 (57 excluding water blocks).

More about census blocks. In built-up urban areas, a census block often shares a boundary with a conventional 4-sided city block. Census blocks are normally bounded by roads and in some cases other types of physical boundaries. For Census 2010, each census block is coded as urban or rural; this is the basis for defining urban or rural population and geographies such as urbanized areas. See urban population and urban/rural ZIP Codes. Census block geography nest within block groups and census tracts.

Upcoming sections will focus on accessing, integrating and using New York City block group and census tract demographic-economic data. Unlike census blocks, annually updated demographic-economic data are available for block groups and census tracts from the American Community Survey.

About the Author
— Warren Glimpse is former senior Census Bureau statistician responsible for innovative data access and use operations. He is also the former associate director of the U.S. Office of Federal Statistical Policy and Standards for data access and use. He has more than 20 years of experience in the private sector developing data resources and tools for integration and analysis of geographic, demographic, economic and business data. Contact Warren. Join Warren on LinkedIn.

Data Analytics Labs: Resources & Methods to Create & Apply Insight

.. it has always been that an important first step in Data Analytics was developing or acquiring the key data to be analyzed.  Having the right subject matter data for the right geography and time frame are essential prerequisites.  The Internet and pervasive expanding needs and solutions for data integration has made Data Analytics easier and more accessible — and often more technically challenging.  The Data Analytics Lab, reviewed here, offers a foundational and support framework to address the continually evolving Data Analytics needs. See more about the Data Analytics Lab in the related Web section.

Data Analytics involves more than the ability to perform statistical analyses on data, though this is an important element. Data Analytics encompasses a spectrum of data and the ability to develop, access, integrate and effectively use those data. The platform of data on which we operate is constantly in change. New and different types of data emerge. Older data become obsolete. Required subject matter are often not available at the required geographic granularity. Often the biggest challenge is in linking data for analysis.

Role of Geographic Information Systems (GIS)
GIS software is one on many Data Analytics tools. It is an important tool for many reasons. One main reason is the enabling ability to flexibly visually examine subject matter for different types of geography simultaneously. The following view shows patterns of economic prosperity in the Atlanta region (metro shown with bold boundary). The thematic pattern is median household income by block group. Higher income areas are shown in blue/green and lower income areas are shown in orange/red. Counties are shown with black boundaries.

The next view is a zoom-in to the pointer location in the map shown above. This view has a higher transparency setting enabling a see-though effect to view highways and related ground infrastructure. Block groups appear with black boundaries. The pointer is at the county boundary, a slightly bolder boundary.

Data Analytics Labs (DAL) help participants develop a capacity to create map views like those shown above and perform geospatial analyses. This is more than learning how to operate GIS software; more than how to acquire shapefiles and build a GIS project. It is about selecting and acquiring the right subject matter data and then integrating those data with geometry (shapefiles, etc.) and assembling the composite files for analysis. DAL learning enables participants to develop informative and relevant maps view — and the right types of different geographies (including vintages) to use.

Data Analytics Labs are set up within universities, government agencies and not-for-profit organizations to address these needs. Contact us to discuss how a Lab can be developed within your organization.

A Data Analytics Lab provides tools/resources for hands-on data analytics applications. In a university setting, the Lab can be open to MBA, MPA, MHA and other graduate students plus multi-disciplinary faculty/researchers. Also in the university setting, some parts of a Lab can fit into existing classes and mesh with other existing programs. There is no physical lab; it is a virtual lab. The resources and vision are initially focused on Census-type geographic-demographic-economic data, expanded to selected Federal statistical data, and how these and primary data are knitted together for analysis and decision-making.

There are no fees to participants. Tools and data are made available by ProximityOne — http://proximityone.com.

Data Analytics Lab Resources & Components
1. Software
    • CV XE GIS software
      – GIS shapefiles and applications compatible with ESRI ArcGIS software
    • API data access/integration software
    • Modeler software
      – cause & effect modeling; estimation & forecasting; impact analysis
    • Related software
2. Data Resources
    • state & national scope ready to use GIS projects
    • augmented TIGER/DMD geography
    • U.S. national scope 5-year demographic-economic estimates & projections
      –  small area demographic-economic estimates/projections to 2020
    • U.S. national scope county/up 2060 demographic projections
      – population projections to 2060 (single year of age x gender x race/origin)
    • ProximityOne Data Services (PDS)
      – multi-sourced Federal , Census and other data resources
3. U.S. by state/metro/county macro models (uses software and data above)
    • enable users to explore alternative model specifications/assumptions
    • produce alternative outcomes; perform impact analyses
4. Data Analytics Lab Sessions
    • variations on weekly Web-based sessions
5. Certificate in Data Analytics Modules
    • structured usage of Data Analytics Certificate program sessions/resources
6. Intern Participation: Data Analytics Tools Development and Applications
    • model specification & use; software development & use; data resource development & use

Forthcoming sections will review examples of Data Analytics Labs, how and where they are operating and experiences of participants.

About the Author
— Warren Glimpse is former senior Census Bureau statistician responsible for innovative data access and use operations. He is also the former associate director of the U.S. Office of Federal Statistical Policy and Standards for data access and use. He has more than 20 years of experience in the private sector developing data resources and tools for integration and analysis of geographic, demographic, economic and business data.

Examining Characteristics of America’s Smaller Cities

.. As of 2014, there were 19,509 incorporated cities/places in the U.S. 12,744 (65.3%) of these cities had a 2014 population of 2,500 or less; 15,834 (81.2)%) had a population of 7,500 or less. Rank, compare, query all cities using this interactive table. Examine change since 2010. This section illustrates how to examine more detailed characteristics for any one of these cities — irrespective of population size.

Sandpoint, Idaho: Patterns of Economic Prosperity

— Sandpoint, ID shown with bold black boundary
— colors show patterns of median household income by census tract
— view developed with CV XE GIS

Sandpoint, ID, 2014 population 7,760, intersects with three census tracts.  One of these tracts completely encompasses the places of Ponderay and Kootenai, located to the northeast of Sandpoint.  The next map shows Sandpoint in context of Bonner County, ID

Sandpoint, ID Demographic-Economic Characteristics
The following graphic shows a partial view of a demographic-economic profile for Sandpoint, ID. View the full profile here. Get a profile for any U.S. city.

The profile shows demographic-economic attributes of Sandpoint based on American Community Survey (ACS) 2012 and 2013 5-year estimates. 2014 5-year estimates will be available in December 2015.

The full profile tells a lot more about the city than only population by age. These attributes include school enrollment, educational attainment, migration, language spoken at home, employment status, employment by industry, income and wide ranging housing characteristics. Get the corresponding profile for the county or adjacent city. Compare attributes side-by-side.

About the Author
— Warren Glimpse is former senior Census Bureau statistician responsible for innovative data access and use operations. He is also the former associate director of the U.S. Office of Federal Statistical Policy and Standards for data access and use. He has more than 20 years of experience in the private sector developing data resources and tools for integration and analysis of geographic, demographic, economic and business data.

Demographic-Economic Patterns: Composite & Related Geography

.. we often need data for study areas that do not conform to conventional political/statistical geography. The geography for a market, sales territory, impact zone or other type of study area often do not align with political or statistical geographic areas for which relevant demographic-economic data are available. While the interest might be in demographic-economic characteristics for a particular county, patterns and trends within a county cab vary widely for sub-county geography such as ZIP code areas, census tracts, cities, school districts and other types of geography. It is important to be able to examine the composite, or drill-down, geography for a larger area. Related geography are equally important. Even though primary interest might be in three ZIP code areas, knowing about patterns in related, contiguous ZIP codes is also important. This section illustrates how to examine semi-comprehensive demographic-economic characteristics and trends using organized profiles for alternative geography.

Patterns of Economic Prosperity by Neighborhood
ZIP Code Area 60565
in Naperville, IL area — bold black boundary

– note this ZIP code area intersects with many census tracts;
    … in many cases tract boundaries are not coterminous with ZIP code.
– colors show patterns of median household income by census tract
– view developed with CV XE GIS … view full profile

More information — get for your areas anywhere in U.S.

Illustrative set of different types of geography; Naperville, IL; Chicago metro.
Click links to view full profile.
ZIP Code Area 60565 — Naperville, IL area — see graphic above
Census Tract 17197880119 — Naperville, IL area — see graphic below
Naperville city, IL — see graphic below
Naperville School District, IL — see graphic below
DuPage County, IL — see graphic below

Patterns of Economic Prosperity by Neighborhood
Census tract 17197880119
in Naperville, IL area — bold black boundary

– ZIP code 60565 shown with red boundary.
– colors show patterns of median household income by census tract
– view developed with CV XE GIS … view full profile

Patterns of Economic Prosperity by Neighborhood
Naperville, IL city
— cross-hatched pattern, bold black boundary

– colors show patterns of median household income by census tract
– view developed with CV XE GIS … view full profile

Patterns of Economic Prosperity by Neighborhood
Naperville School District, IL
— cross-hatched pattern, bold black boundary

– Naperville city shown with semi-transparent cross-hatch pattern.
– colors show patterns of median household income by census tract
– view developed with CV XE GIS … view full profile

Patterns of Economic Prosperity by Neighborhood
DuPage County, IL
— cross-hatched pattern, bold black boundary

– Naperville city shown with semi-transparent cross-hatch pattern.
– colors show patterns of median household income by census tract
– view developed with CV XE GIS … view full profile

There are many other ways to use composite and related geography in data analytics. GIS tools enable wide-ranging geospatial analysis not covered in detail here. See more about this topic in the data analytics program.

About the Author
— Warren Glimpse is former senior Census Bureau statistician responsible for innovative data access and use operations. He is also the former associate director of the U.S. Office of Federal Statistical Policy and Standards for data access and use. He has more than 20 years of experience in the private sector developing data resources and tools for integration and analysis of geographic, demographic, economic and business data.