Category Archives: Geographic Information Systems

How & Why County Population is Changing

… did you know? Of the total 3,144 counties in the United States, 48 have more than 1 million residents as of 2023. Learn which counties, where they are and how/why they are changing. Use tools and methods described in this section to learn about how and why your counties of interest are changing. This is one of a series on the topic of county population dynamics. Click the Follow button to receive update notices.

Largest, Fast Growing Counties
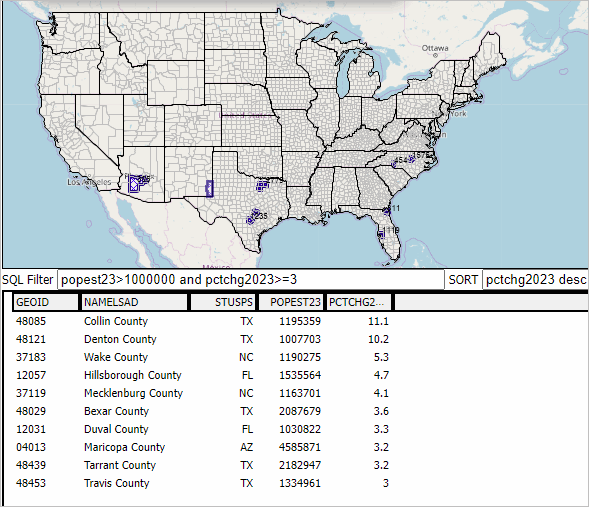
The following graphic shows the largest 10 counties, experiencing 3% or more growth from 2020 to 2023, based on the latest official population estimates. Counties are ranked based on the population percent change 2020 to 2023. Collin County, TX, in the Dallas metro, leads the group with an 11.3% gain. You can create similar but different views/analytics using the OVDAW online tool described below. Click graphic for larger view.
Why these Data are Important
These data are official Federal county statistics. They are used by the Federal, state and local governments in a wide range of application areas. These data are used by Federal agencies to analyze, administer programs, develop other data. The Bureau of Economic Analysis will use these data to produce Personal Income by County and Metropolitan Area, 2023 (November) and Real Personal Consumption Expenditures by State and Real Personal Income by State and Metropolitan Area, 2023 (December), among others. They are used within the Census Bureau as controls for statistical survey estimates. They are the population county components used to develop corresponding CBSA/metro data. They are used as measure of how, why and by how much county population is changing. They provide insights into, for example, where a business might open a new business based in part on changing population. The components of population change tell us yet other things .. reviewed in upcoming blogs.

Start Using Open VDA Web GIS (OVDAW)
Nothing to install, no registration, no fee.
Start creating maps and analyzing data.
  • Click here to Start Open VDA Web GIS
  • Click here to Learn More About Using OVDAW

More About Population & Components of Change
These “population and components of change” annual data 2020 through 2023 are an annually updated time series enabling stakeholders to examine trends and perform wide-ranging analyses. The 2020-2023 data are model-based estimates developed by the Census Bureau. ProximityOne uses these and related data to develop projections annually through 2060.
Components of change include births, deaths and migration. Estimates and projections are developed using the population identity:
P[t] = P[t-1] + B[t,t-1] + D[t,t-1] + M[t,t-1]
Population for the year t are determined by adding the population last year to births (B), subtracting deaths (D) and adding net migration (M) during the year. The components are determined using separate equations in the model.

About VDA GIS
Use VDA GIS tools to meet wide-ranging mapping needs and geospatial analysis. VDA Desktop GIS and VDA Web GIS have similar features that can be used separately or together. Each is a decision-making information resource designed to help stakeholders create and apply insight. VDA Web GIS is access/used with only a Web browser; nothing to install; GIS experience not required. VDA Desktop GIS is installed on a Windows computer and provides a broader range of capabilities compared to VDA Web GIS. VDA GIS resources have been developed and are maintained by Warren Glimpse, ProximityOne (Alexandria, VA) and Takashi Hamilton, Tsukasa Consulting (Osaka, Japan).

Data Analytics Web Sessions
Join us in the every Tuesday, Thursday Data Analytics Web Sessions. See how you can use VDA Web GIS and access different subject matter for related geography. Get your geographic, demographic, data access & use questions answered. Discuss applications with others.

About the Author
Warren Glimpse is former senior Census Bureau statistician responsible for national scope statistical programs and innovative data access and use operations. He is also the former associate director of the U.S. Office of Federal Statistical Policy and Standards for data access and use. He has more than 20 years of experience in the private sector developing data resources and tools for integration and analysis of geographic, demographic, economic and business data. Join Warren on LinkedIn.

Examining Congressional Districts using VDA Desktop GIS via RDS

.. this section builds on the previous section “Using VDA Desktop GIS with Remote Desktop“. To recap, that section summarized how to make reference and geostatistical maps using the VDA Desktop GIS online via our Remote Desktop Service. Perform simple, easy-to-use mapping tasks, or more advanced geospatial analyses using VDA, Visual Data Analytics, GIS .. Geographic Information Systems. Here I review how to use any VDA GIS project with only Internet and most any device.

An Example using the California CD 06 (CD0646) GIS Project
1. Start VDA Desktop GIS using Remote Desktop Service .. see details.
2. When the RDS screen appears, click the VDAGIS icon, starting VDAD/RDS
.. this shows the default view, the “Base” GIS project.
3. Use File>Open to open the CD0646 GIS project
.. Next, the user could open any available GIS project.
.. Click File>Open then select file c:\cvxe\cd0646\cd0646.gis .. the project opens
.. Congressional District California 46
.. located in the Anaheim – Santa Ana area of Orange County, CA
4. Reviewing the Start-up View
The following graphic shows, the project start-up view
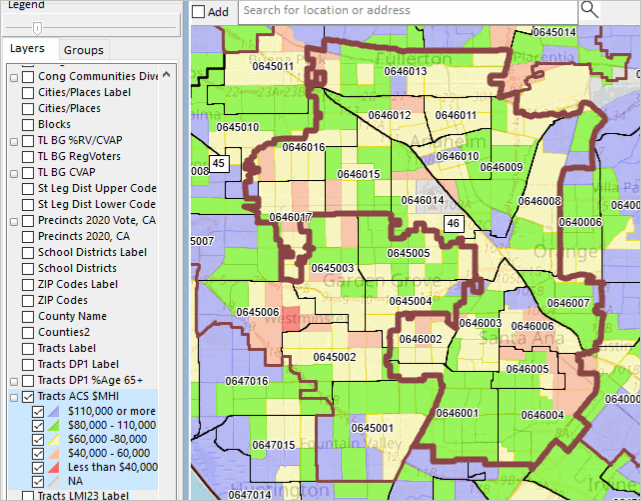
.. California CD 46 (bold boundary) and Congressional Communities
.. examining economic prosperity (median household income) by census tract</a.

CA CD 46 with CCs; Patterns of Economic Prosperity .. click for larger view

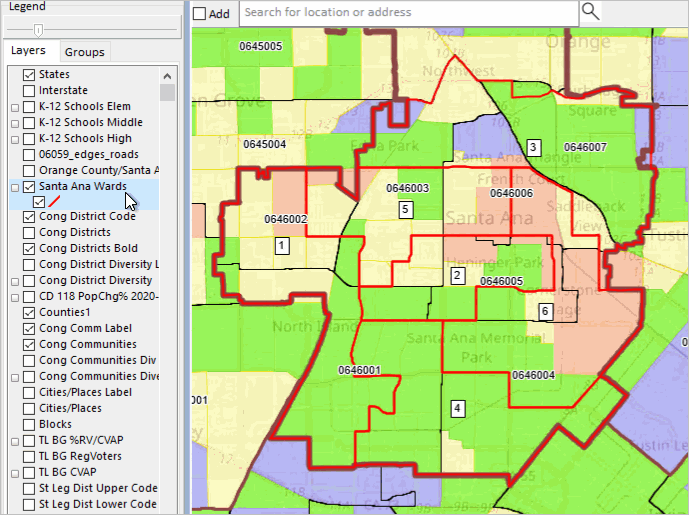
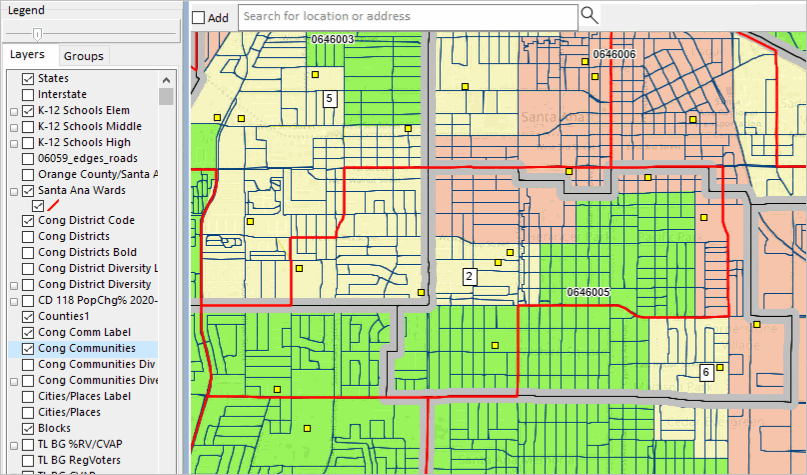
Drill-down View of Santa Ana area by Ward .. click for larger view
This zoom-in view shows Santa Ana wards as with red boundaries in context of other geography reviewed above.

See Santa Ana ward boundaries using the official Santa Ana City website.

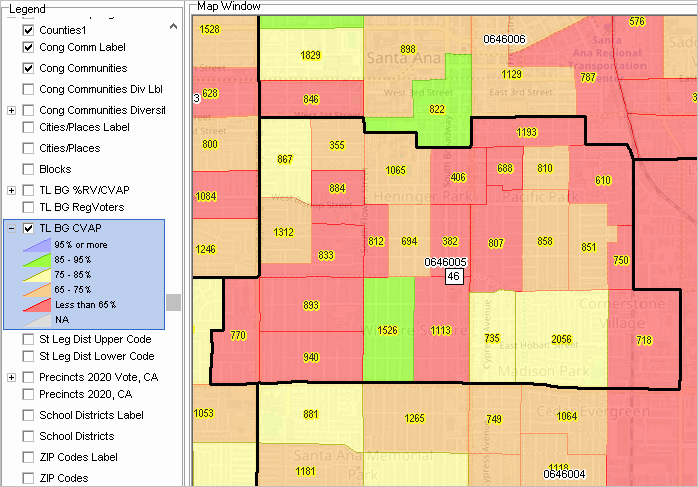
Citizen Voting Age Population by Block Group .. click for larger view
The following zoom-in view shows patterns of Citizen Voting Age Population (CVAP) by block group (BG) in the Santa Ana area in context of Congressional Community 0646005 (bold black boundary). Label shows total CVAP in that BG.

Drill-down View to Ward-CC-Block .. click for larger view
This zoom-in view shows one Santa Ana ward (red boundary) in context of census blocks (black boundaries) and related Congressional Community (gray bold boundary). Congressional Communities (CC) are geographic areas that nest within a Congressional District (CD), fully and exactly exhausting that CD area. CCs are comprised of a set of contiguous census blocks based on a range of criteria.

What’s Ahead
Updates on using VDA Desktop GIS will be included in forthcoming Blogs.
Don’t miss out! Click Follow in button at upper right.

About VDA GIS
Use VDA GIS tools to meet wide-ranging mapping needs and geospatial analysis. VDA Desktop GIS and VDA Web GIS have similar features that can be used separately or together. Each is a decision-making information resource designed to help stakeholders create and apply insight. VDA Web GIS is access/used with only a Web browser; nothing to install; GIS experience not required. VDA Desktop GIS is installed on a Windows computer and provides a broader range of capabilities compared to VDA Web GIS. VDA GIS resources have been developed and are maintained by Warren Glimpse, ProximityOne (Alexandria, VA) and Takashi Hamilton, Tsukasa Consulting (Osaka, Japan).

Data Analytics Web Sessions
Join us in the every Tuesday, Thursday Data Analytics Web Sessions. See how you can use VDA Web GIS and access different subject matter for related geography. Get your geographic, demographic, data access & use questions answered. Discuss applications with others.

About the Author
Warren Glimpse is former senior Census Bureau statistician responsible for national scope statistical programs and innovative data access and use operations. He is also the former associate director of the U.S. Office of Federal Statistical Policy and Standards for data access and use. He has more than 20 years of experience in the private sector developing data resources and tools for integration and analysis of geographic, demographic, economic and business data. Join Warren on LinkedIn.
Using VDA Desktop GIS with Remote Desktop

.. make reference and geostatistical maps using the VDA Desktop GIS online via our Remote Desktop Service. Perform simple, easy-to-use mapping tasks, or more advanced geospatial analyses. VDA .. Visual Data Analytics. GIS .. Geographic Information Systems. Here I review how to do this with only Internet and most any device. VDA Desktop GIS and associated “Base” project provides access to the Federal Statistical System and much more.

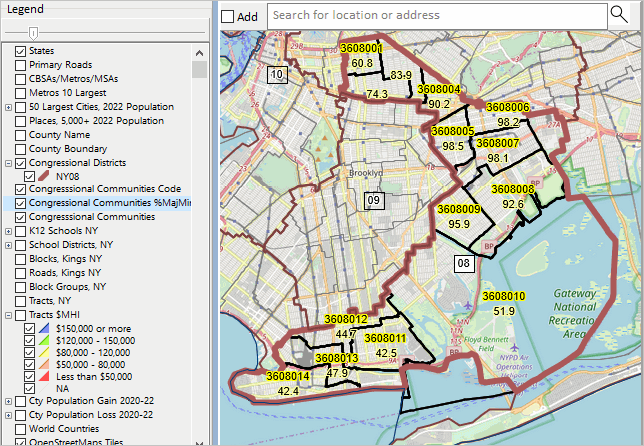
New York Congressional District 08 by Congressional Community .. an example
.. CD NY08 with CCs labeled with %Majority Minority .. click for larger view

How to use Remote Desktop Service Remote Desktop was envisioned as a protocol to connect a user’s desktop/device via Internet to a remote computer so that the user could access, run, use their files on the remote computer. Remote Desktop Service (RDS) provides far greater capabilities. In our case, we have installed VDA Desktop GIS (VDAD) on the Server enabling a user to run VDAD as if it were operating on the user’s computer. This enables a user to run VDAD 1) without installing anything and 2) using VDAD, a Windows-based program, on Macs, iOS and other devices.

Using VDAD with Remote Desktop Service
Start Remote Desktop Service. If this is the first time used, after starting RDS click the Add PC on the RDS interface, then key in the Server IP address .. 50.62.180.232. Next click the Server graphic. Next login using your userid and password. If needed, register here to get your userid and password. No fee. After logging in, click the VDAGIS icon to start VDAD.

VDAD Start-up View
Start up view shows counties; 48 contiguous states .. click for larger view

See more about using VDAD via RDS

Updates on using VDA Desktop GIS will be included in forthcoming Blogs.
Don’t miss out! Click Follow in button at upper right.

About VDA GIS
Use VDA GIS tools to meet wide-ranging mapping needs and geospatial analysis. VDA Desktop GIS and VDA Web GIS have similar features that can be used separately or together. Each is a decision-making information resource designed to help stakeholders create and apply insight. VDA Web GIS is access/used with only a Web browser; nothing to install; GIS experience not required. VDA Desktop GIS is installed on a Windows computer and provides a broader range of capabilities compared to VDA Web GIS. VDA GIS resources have been developed and are maintained by Warren Glimpse, ProximityOne (Alexandria, VA) and Takashi Hamilton, Tsukasa Consulting (Osaka, Japan).

Data Analytics Web Sessions
Join us in the every Tuesday, Thursday Data Analytics Web Sessions. See how you can use VDA Web GIS and access different subject matter for related geography. Get your geographic, demographic, data access & use questions answered. Discuss applications with others.

About the Author
Warren Glimpse is former senior Census Bureau statistician responsible for national scope statistical programs and innovative data access and use operations. He is also the former associate director of the U.S. Office of Federal Statistical Policy and Standards for data access and use. He has more than 20 years of experience in the private sector developing data resources and tools for integration and analysis of geographic, demographic, economic and business data. Join Warren on LinkedIn.
New 2023 Metropolitan Area Delineations

.. new 2023 CBSA/metro delineations have just been released. See more about the 2023 delineations. Core-Based Statistical Areas (CBSAs) are officially designated by the U.S. Office of Management and Budget (OMB). CBSAs are composed of one or more contiguous counties and must meet a population size criteria of associated Urban Area(s). CBSAs are classified as the larger Metropolitan Statistical Areas (MSAs; 387 in United States and 6 in Puerto Rico) and smaller Micropolitan Statistical Areas (MISAs; 538 in United States and 4 in Puerto Rico). Use the interactive table to view, rank, query 2023 CBSAs by component area.

These changes can have a profound impact on matters including policy formulation, resource allocation, general research .. to name a few. If you have data by metro, and the geography of the metro changes over time, analytical results, trend implications, can be very misleading. But there’s more.

Two notable aspects about the new 2020 CBSA standards, used for the 2023 delineations, are that they 1) no longer make use of NECTAs (New England City and Town Areas) and 2) the qualifying core population is now based on the population size of the relevant Urban Area(s) rather than cities.

The Houston, TX Metro — an Illustrative Example
The Houston, TX metro (MSA) changed from 9 counties based on the 2020 CBSA delineations to 10 counties based on the 2023 delineations. As shown in the graphic below, San Jacinto County, TX was added. The bold orange boundary shows the 2023 delineations. The black bold boundary shows the 2020 delineations. Note that four counties contiguous to the Houston MSA became MSAs effective with the 2023 delineations. These counties were classified as MISAs before the 2023 delineation.

CBSA/Metro Mapping & GeoSpatial Analysis
View and examine the 2020 and 2023 vintage CBSAs using the VDA Web GIS with the MetroDynamics GIS project. Examine metros in context of other geography. Click here to start VDA Web GIS; uses a browser, nothing to install. Use the spreadsheet/grid feature to examine the metros in a tabular manner.

About VDA GIS
Use VDA GIS tools to meet wide-ranging mapping needs and geospatial analysis. VDA Desktop GIS and VDA Web GIS have similar features that can be used separately or together. Each is a decision-making information resource designed to help stakeholders create and apply insight. VDA Web GIS is access/used with only a Web browser; nothing to install; GIS experience not required. VDA Desktop GIS is installed on a Windows computer and provides a broader range of capabilities compared to VDA Web GIS. VDA GIS resources have been developed and are maintained by Warren Glimpse, ProximityOne (Alexandria, VA) and Takashi Hamilton, Tsukasa Consulting (Osaka, Japan).

Data Analytics Web Sessions
Join us in the every Tuesday, Thursday Data Analytics Web Sessions. See how you can use VDA Web GIS and access different subject matter for related geography. Get your geographic, demographic, data access & use questions answered. Discuss applications with others.

About the Author
Warren Glimpse is former senior Census Bureau statistician responsible for national scope statistical programs and innovative data access and use operations. He is also the former associate director of the U.S. Office of Federal Statistical Policy and Standards for data access and use. He has more than 20 years of experience in the private sector developing data resources and tools for integration and analysis of geographic, demographic, economic and business data. Join Warren on LinkedIn.
School District Geography & GeoSpatial Analysis

.. the approximate 100,000 K-12 public schools, 13,000 school districts and 50 million school age children in the United States touch nearly every dimension of society and the economy. This section reviews the scope of school district geography as cachement areas for the K-12 public schools and school age population .. and tools to examine them in an integrated and holistic manner. How does school district instructional expenditure relate to the demographic-economic make-up of the district? Educational outcomes? How are leaders and educators equipped to make effective use of these tools and data?

School districts are geographic areas covering the U.S. to provide public K-12 education. I developed the first national scope school district boundary file in the mid-1990s, a joint project of the U.S. National Center for Education Statistics and the Census Bureau. School district boundaries are now updated annually as a part of the Census Bureau TIGER digital map database under the sponsorship of the U.S. National Center for Education Statistics (NCES). School district names, codes, enrollment by grade and many other attributes are updated annually as a part of the NCES Common Core of Data (CCD). The 2021-22 (latest data as of this time) school district CCD administrative data provides data for approximately 13,025 “regular” school districts. The CCD data are one type of data that can be merged (based on a common key of the NCES assigned local education ID) with TIGER-based school district shapefiles that can enable mapping and geospatial analysis. Using these shapefiles with Geographic Information System (GIS) software users can examine maps of districts by name, view boundaries or patterns such the per pupil instructional expenditure.

Types of School Districts
School districts, whose boundaries and operations are defined and managed by individual states, often exist as three types of school districts in differing combinations: elementary, secondary and unified. Some states have only unified school districts that are also the same as the counties (such as Florida, Kansas, Maryland and Nevada). California has perhaps the most complex array of mixed elementary, secondary and unified districts.

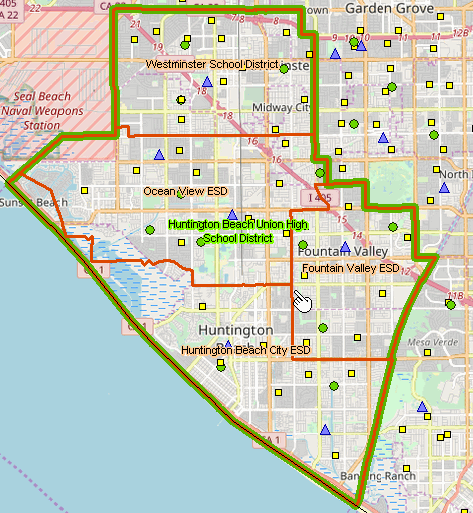
Huntington Beach, CA School Districts
The following view shows how 4 elementary districts (orange boundaries) each offering grades K-8 education collectively cover the same ground area as 1 secondary district, Huntington Beach Unified High School District (green bold boundary) offering grades 9-12 education.

K-12 School & School District GIS Project
The VDA GIS ready to use K-12 School & School District GIS project with CV XE GIS, VDA Desktop GIS or the VDA Web GIS to examine and geospatially analyze school districts and school district attributes in context of other geography and subject matter. For example, the following view shows patterns of neighborhood economic prosperity (median household income by census tract) for the Huntington Beach, CA school districts. Click graphic for larger view.

Viewing Your School District
To view your school district, follow these steps:
Start VDA Web GIS
Select the “K-12 Schools & School Districts” project.
When the map view opens
.. uncheck School District Elementary and School District Secondary
    in Legend Panel at left
Enter address in Search box above map (Apple Headquarters in this example)
Press enter and this view appears .. click blue triangle to view profile.
.. see that this district is Santa Clara Unified ..

About VDA GIS
There are two VDA GIS tools that have similar features that can be used separately or together. Each is a decision-making information resource designed to help stakeholders create and apply insight. VDA Web GIS is access/used with only a Web browser; nothing to install; GIS experience not required. VDA Desktop GIS is installed on a Windows computer and provides a broader range of capabilities compared to VDA Web GIS. VDA GIS resources have been developed and are maintained by Warren Glimpse, ProximityOne (Alexandria, VA) and Takashi Hamilton, Tsukasa Consulting (Osaka, Japan).

Data Analytics Web Sessions
Join us in the every Tuesday, Thursday Data Analytics Web Sessions. See how you can use VDA Web GIS and access different subject matter for related geography. Get your geographic, demographic, data access & use questions answered. Discuss applications with others.

About the Author
Warren Glimpse is former senior Census Bureau statistician responsible for national scope statistical programs and innovative data access and use operations. He is also the former associate director of the U.S. Office of Federal Statistical Policy and Standards for data access and use. He has more than 20 years of experience in the private sector developing data resources and tools for integration and analysis of geographic, demographic, economic and business data. Join Warren on LinkedIn.
Mapping Statistical Data

.. statistical mapping & visual data analysis … Geographic Information Systems (GIS) provide flexible and powerful capabilities to combine maps/geography with statistical data. In our increasingly data rich environment, we often experience “drowning in data.” GIS tools can help harness disparate and voluminous data and assist with data linkage. We are continuing to update the Mapping Statistical Data (MSD) program, providing access to ready-to-use, “production” GIS projects and datasets that you can use. This post reviews GIS tools that help enable this .. gaining insights by mapping and geospatial analysis of statistical data. Take a look at the recent addition .. census tracts experiencing persistent poverty. Follow this blog to learn about new, additional projects added to the MSD program.

The Virtual Data Analytics (VDA) Geographic Information System (about GIS) tools/resources operate on two platforms. The VDA Desktop GIS (VDAD) operates on a Windows computer. The VDA Web GIS (VDAW) operates on most devices, including Macs and phones, and is accessed/used with a browser. VDAD and VDAW can optionally use the same GIS project. Three examples of using the Congressional Communities GIS project using different VDA GIS tools are shown below. They look almost identical (the objective). Click graphic for larger view. See more about the Congressional Communities project.

VDA Desktop GIS – Opening a Local GIS Project
In this example, all files are stored locally.
The user interface is managed by VDA Desktop GIS program on the local computer.

VDA Desktop GIS – Opening a Web GIS Project
In this example, all files are stored on a VDA GIS server.
The user interface is managed by VDA Desktop GIS program on the local computer.

VDA Web GIS – Opening a Web GIS Project
In this example, all files are stored on a VDA GIS server.
The user interface is managed by VDA Web GIS on a VDA server.

About VDA GIS
There are two VDA GIS tools that have similar features that can be used separately or together. Each is a decision-making information resource designed to help stakeholders create and apply insight. VDA Web GIS is access/used with only a Web browser; nothing to install; GIS experience not required. VDA Desktop GIS is installed on a Windows computer and provides a broader range of capabilities compared to VDA Web GIS. VDA GIS resources have been developed and are maintained by Warren Glimpse, ProximityOne (Alexandria, VA) and Takashi Hamilton, Tsukasa Consulting (Osaka, Japan).

Data Analytics Web Sessions
Join us in the every Tuesday, Thursday Data Analytics Web Sessions. See how you can use VDA Web GIS and access different subject matter for related geography. Get your geographic, demographic, data access & use questions answered. Discuss applications with others.

About the Author
Warren Glimpse is former senior Census Bureau statistician responsible for national scope statistical programs and innovative data access and use operations. He is also the former associate director of the U.S. Office of Federal Statistical Policy and Standards for data access and use. He has more than 20 years of experience in the private sector developing data resources and tools for integration and analysis of geographic, demographic, economic and business data. Join Warren on LinkedIn.

Measuring & Analyzing Households by Social Class by PUMA

.. a social class is a population or household group typically referred to as a lower, middle and upper class. The size of the population or households in a social class is often determined in relationship to an interval related to the median household income of an area — from two-thirds of median household income to twice the median household income (MHI). Subsequent blog posts will address a broader definition for class determination. By better understanding composition and determinants of social class for an area, we might better understand and improve on income inequality and create new opportunities. This is a multi-part blog post on social class analytics. Click Follow at right to receive updates.

Percent Population in Households by Social Class by PUMA
.. Los Angeles area .. click for larger view.

Los Angeles metro area by social class .. PUMAs shown with black boundaries; pointer at Los Angeles-Orange County line

Percent of Households by Social Class by PUMA
.. Los Angeles area .. click for larger view.

Los Angeles metro area by social class .. PUMAs shown with black boundaries; pointer at Los Angeles-Orange County line

Using American Community Survey Microdata
We use of the American Community Survey microdata or “public use microdata samples” (PUMS) http://proximityone.com/pums.htm to develop estimates of population and households by middle class, lower class and upper class by “public use microdata area” (PUMA) http://proximityone.com/puma.htm. Microdata files are comprised of anonymized individual respondent data within PUMAs. The approximate 2,800 PUMAs cover the U.S. wall-to-wall and must have 100,000 population or more. 2010 and 2020 vintages PUMAs may be examined and compared with other geography using the VDA Web GIS http://proximityone.com/vda.htm with the MetroDynamics Project.

Social Class Participation by PUMA
Using custom software, the PUMA (ACS 2021 1 year data in this case), individual housing records are summarized for each PUMA. An estimate is developed for the lower, middle and upper class based on an algorithm.

Examine patterns of social class stratification using VDA Web GIS anywhere in U.S.
The estimates are then integrated into a PUMA shapefile. The PUMA shapefile is added to a Geographic Information System (GIS). Access this shapefile/layers using VDA Web GIS to examine patterns of social class, such as the graphics shown above, or in combination with other geography and subject matter.

About VDA GIS
VDA Web GIS is a decision-making information resource designed to help stakeholders create and apply insight. Use VDA Web GIS with only a Web browser; nothing to install; GIS experience not required. VDA Web GIS has been developed and is maintained by Warren Glimpse, ProximityOne (Alexandria, VA) and Takashi Hamilton, Tsukasa Consulting (Osaka, Japan).

Data Analytics Web Sessions
Join us in the every Tuesday, Thursday Data Analytics Web Sessions. See how you can use VDA Web GIS and access different subject matter for related geography. Get your geographic, demographic, data access & use questions answered. Discuss applications with others.

About the Author
Warren Glimpse is former senior Census Bureau statistician responsible for national scope statistical programs and innovative data access and use operations. He is also the former associate director of the U.S. Office of Federal Statistical Policy and Standards for data access and use. He has more than 20 years of experience in the private sector developing data resources and tools for integration and analysis of geographic, demographic, economic and business data. Join Warren on LinkedIn.

Examining City GeoDemographic Drilldown; Intersecting Tracts and Places

.. how can “our city” do a better job of providing housing for low-income individuals and families? One part of a successful program involves looking at attributes of the neighborhood, or census tract, geography across the city. We need to analyze needs by city component census tracts, areas averaging 4,000 population. Here is how that might be approached — determining which census tracts. And while this applies to low income housing, it applies to many other planning topics.

Relate census tract geography to city/place geography using GIS tools for analytical purposes … determine which tracts intersect a city/place. This section considers intersecting tracts and places for illustrative purposes. But the methodology, and tools to do this, involve many, many other types of geography .. geographic spatial intersection. The inputs in this case are U.S. national scope 2020 census tracts (85,190 areas covering the U.S. wall-to-wall) and U.S. national scope 2020 places (32,188 areas). The output from the process of intersecting these geographies are tract-place intersecting parts (119,906 areas). There are 32,146 tracts that are wholly contained in places.

Developing Intersect Files
Tracts intersecting with cities can be determined using the VDAGIS Intersect tool. Select the two input shapefiles and name the intersect output shapefile. The intersect shapefile is added to the GIS project being used.

Focusing on a City
What tracts intersect a city of interest? By having this information, stakeholders, policymakers can study and better understand inequities, differences and needs across the city. Consider Santa Ana, CA (Orange County). There are 65 tracts that intersect with the city of Santa Ana. This could be any city across America. The following view shows Santa Ana with intersecting tracts.

By viewing the intersecting file in VDAGIS, intersecting tracts can be examined. The graphic below shows a zoom-in to tract 06059089102 (blue boundary). This tract is shown at the pointer in the above graphic. in the following zoom-in view, the white label shows the tract code for the whole tract and the two split parts are shown with the same code. The part to the right in Santa Ana city, the part to the left is in Garden Grove city.

Using the intersecting file, the list (a partial list) of these tracts and tract codes can be determined as shown below. By knowing the tract codes, detailed demographic-economic data can be pulled using DEDE and tract characteristics can be studied. Inequities ab be examined, special needs can be determined, east versus west tract groups might identify patterns to facilitate collaboration and policy development. What are the patterns of affordable housing across the city?

About VDAGIS
VDA Web GIS is a decision-making information resource designed to help stakeholders create and apply insight. Use VDA Web GIS with only a Web browser; nothing to install; GIS experience not required. VDA Web GIS has been developed and is maintained by Warren Glimpse, ProximityOne (Alexandria, VA) and Takashi Hamilton, Tsukasa Consulting (Osaka, Japan).

About the Author
Warren Glimpse is former senior Census Bureau statistician responsible for national scope statistical programs and innovative data access and use operations. He is also the former associate director of the U.S. Office of Federal Statistical Policy and Standards for data access and use. He has more than 20 years of experience in the private sector developing data resources and tools for integration and analysis of geographic, demographic, economic and business data. Join Warren on LinkedIn.
The New Urban Geography

.. the nation’s urban population increased by 6.4% between 2010 and 2020 based on 2020 Census data and a change in the way urban areas are defined. As a result of these changes, 1,140 areas containing approximately 4.2 million people, classified as urban in 2010 are now rural. See more about the 2020 urban/rural geography/population. See more about the urban population.

Patterns of the New Urban Geography

click graphic for larger view

As of 2020, there are 2,613 Urban Areas in the U.S. with a combined Census 2020 population of 265,149,027 (80%). The remaining area is defined as rural with Census 2020 population of 66,300,254 (20%).
  • Use this interactive table to view, sort urban areas.
  • Use this interactive table to view, sort states by 2010/2020 urban/rural.

These Federal designated urban areas are comprised of densely settled core of census blocks that meet minimum housing unit density and/or population density requirements. This includes adjacent territory containing non-residential urban land uses. To qualify as an urban area, the territory identified according to criteria must encompass at least 2,000 housing units or a population of at least 5,000. Rural encompasses all population, housing, and territory not included within urban areas.

Importance of Urban/Rural Designations
Data users and researchers interested in analyzing data for urban and rural population and housing use urban area geostatistical data routinely updated by statistical agencies. Analysts use urban area data to study patterns of urbanization, suburban growth and development, and urban/rural land area change.

Larger Urban Areas form the nucleus of Core-Based Statistical Areas (metros). Many metro areas (one or more contiguous counties) contain large rural areas even though some consider metros as large cities. Importantly, they are not the same.

Various federal and state agencies use urban and rural definitions as the basis for their own urban and rural definitions and settlement classifications for use in tabulating and presenting statistical data. The National Center for Education Statistics uses the urban area definitions in its locale codes classification. The U.S. Department of Agriculture uses the urban area classification as the basis for various urban and rural classifications used to analyze and report on demographic and economic patterns in rural areas.

Other government agencies use Urban Area designations to determine program eligibility and in their funding formulas. The Federal Highways Administration uses urban areas of 50,000 or more population to establish Metropolitan Planning Organizations. For rural health programs, a clinic qualifies as a rural health clinic if it is located outside the boundaries of any urban area.

GeoSpatial Analysis of New Urban Geography
Use the VDA Web GIS to examine urban/rural area geographic, demographic and economic make-up and in context of other geography and subject matter.

Urban Areas in the Houston, TX Region

click graphic for larger view

About VDA GIS
VDA Web GIS is a decision-making information resource designed to help stakeholders create and apply insight. Use VDA Web GIS with only a Web browser; nothing to install; GIS experience not required. VDA Web GIS has been developed and is maintained by Warren Glimpse, ProximityOne (Alexandria, VA) and Takashi Hamilton, Tsukasa Consulting (Osaka, Japan).

About the Author
Warren Glimpse is former senior Census Bureau statistician responsible for national scope statistical programs and innovative data access and use operations. He is also the former associate director of the U.S. Office of Federal Statistical Policy and Standards for data access and use. He has more than 20 years of experience in the private sector developing data resources and tools for integration and analysis of geographic, demographic, economic and business data. Join Warren on LinkedIn.

Personal Economic Well-Being

.. examining characteristics, patterns and change in personal economic well-being; learning about what per capita personal income by county tells us. Per capita personal income (PCPI) is the best single measure of personal economic well-being. PCPI differs American Community Survey (ACS) measure of per capita income, median household income and similar income measures as PCPI includes non-monetary income .. PCPI provides a more comprehensive measure. This post provides an update focused on new data released November 2022, county level personal income time series data starting in 1969.

Patterns of 2021 Per Capita Personal Income by County

.. click graphic for larger view
.. use VDA Web GIS for Web-based interactive viewing/analytics.
.. see this more detailed analytical framework for analytics using VDA Desktop.

Importance of these Data
How is the regional economy doing? How is it trending? What policies might be changed to improve personal economic well-being? Answers to these and similar questions are why knowing about personal income and its derivation, components is important — to residents, businesses and governments. While median household income is often considered the best measure of buying power for an area, it is not the best measure of personal or household economic well-being. PCPI and the Regional Economic Information System provides insights and answers to these questions.

U.S. Change in PCPI
In U.S. metropolitan areas, PCPI increased 7.3 percent in 2021, up from 6.0 percent in 2020. In U.S. nonmetropolitan areas, PCPI increased 7.5 percent, down from 7.9 percent.

Regional Economic Information System
PCPI is a small part of the broader Regional Economic Information System (REIS). The following links show examples of detailed tables for Harris County, TX comparing 2019 and 2021 developed using the ProximityOne REIS package. Develop these profiles for any county for your selected year 1970 through 2021.
  • Personal Income by Major Source
  • Earnings by Source & Sector
  • Employment by Type & Sector
  • Transfer Payments
  • Economic Profile
  • Farm Income & Expenditures

About VDA GIS
VDA Web GIS is a decision-making information resource designed to help stakeholders create and apply insight. Use VDA Web GIS with only a Web browser; nothing to install; GIS experience not required. VDA Web GIS has been developed and is maintained by Warren Glimpse, ProximityOne (Alexandria, VA) and Takashi Hamilton, Tsukasa Consulting (Osaka, Japan).

About the Author
Warren Glimpse is former senior Census Bureau statistician responsible for national scope statistical programs and innovative data access and use operations. He is also the former associate director of the U.S. Office of Federal Statistical Policy and Standards for data access and use. He has more than 20 years of experience in the private sector developing data resources and tools for integration and analysis of geographic, demographic, economic and business data. Join Warren on LinkedIn.