
.. new 2023 CBSA/metro delineations have just been released. See more about the 2023 delineations. Core-Based Statistical Areas (CBSAs) are officially designated by the U.S. Office of Management and Budget (OMB). CBSAs are composed of one or more contiguous counties and must meet a population size criteria of associated Urban Area(s). CBSAs are classified as the larger Metropolitan Statistical Areas (MSAs; 387 in United States and 6 in Puerto Rico) and smaller Micropolitan Statistical Areas (MISAs; 538 in United States and 4 in Puerto Rico). Use the interactive table to view, rank, query 2023 CBSAs by component area.
These changes can have a profound impact on matters including policy formulation, resource allocation, general research .. to name a few. If you have data by metro, and the geography of the metro changes over time, analytical results, trend implications, can be very misleading. But there’s more.
Two notable aspects about the new 2020 CBSA standards, used for the 2023 delineations, are that they 1) no longer make use of NECTAs (New England City and Town Areas) and 2) the qualifying core population is now based on the population size of the relevant Urban Area(s) rather than cities.
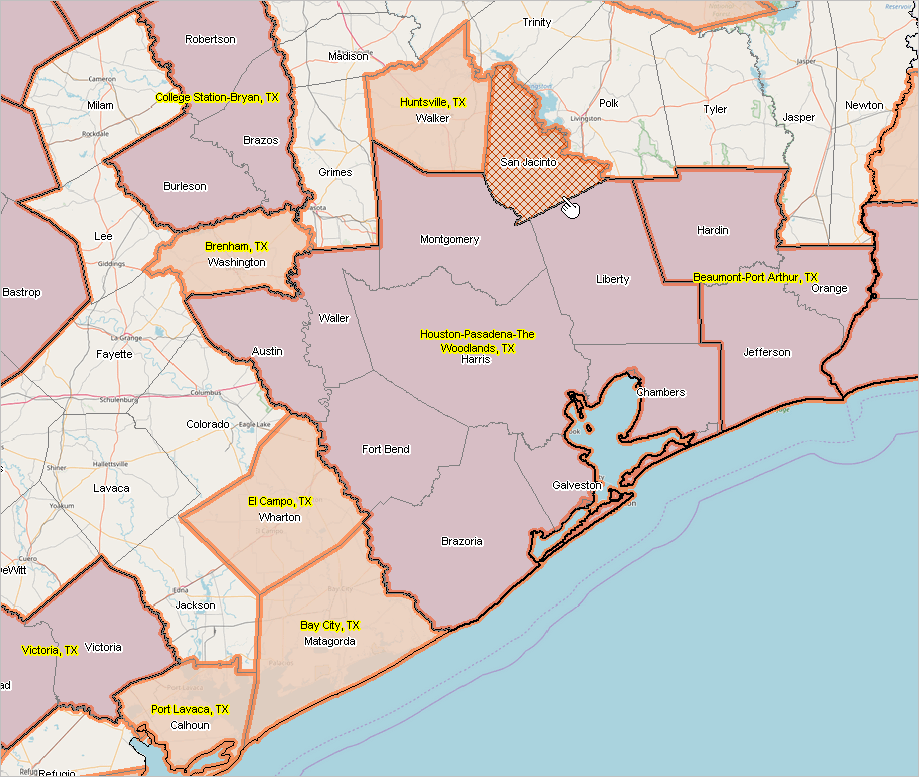
The Houston, TX Metro — an Illustrative Example
The Houston, TX metro (MSA) changed from 9 counties based on the 2020 CBSA delineations to 10 counties based on the 2023 delineations. As shown in the graphic below, San Jacinto County, TX was added. The bold orange boundary shows the 2023 delineations. The black bold boundary shows the 2020 delineations. Note that four counties contiguous to the Houston MSA became MSAs effective with the 2023 delineations. These counties were classified as MISAs before the 2023 delineation.
CBSA/Metro Mapping & GeoSpatial Analysis
View and examine the 2020 and 2023 vintage CBSAs using the VDA Web GIS with the MetroDynamics GIS project. Examine metros in context of other geography. Click here to start VDA Web GIS; uses a browser, nothing to install. Use the spreadsheet/grid feature to examine the metros in a tabular manner.
About VDA GIS
Use VDA GIS tools to meet wide-ranging mapping needs and geospatial analysis. VDA Desktop GIS and VDA Web GIS have similar features that can be used separately or together. Each is a decision-making information resource designed to help stakeholders create and apply insight. VDA Web GIS is access/used with only a Web browser; nothing to install; GIS experience not required. VDA Desktop GIS is installed on a Windows computer and provides a broader range of capabilities compared to VDA Web GIS. VDA GIS resources have been developed and are maintained by Warren Glimpse, ProximityOne (Alexandria, VA) and Takashi Hamilton, Tsukasa Consulting (Osaka, Japan).
Data Analytics Web Sessions
Join us in the every Tuesday, Thursday Data Analytics Web Sessions. See how you can use VDA Web GIS and access different subject matter for related geography. Get your geographic, demographic, data access & use questions answered. Discuss applications with others.
About the Author
Warren Glimpse is former senior Census Bureau statistician responsible for national scope statistical programs and innovative data access and use operations. He is also the former associate director of the U.S. Office of Federal Statistical Policy and Standards for data access and use. He has more than 20 years of experience in the private sector developing data resources and tools for integration and analysis of geographic, demographic, economic and business data. Join Warren on LinkedIn.
