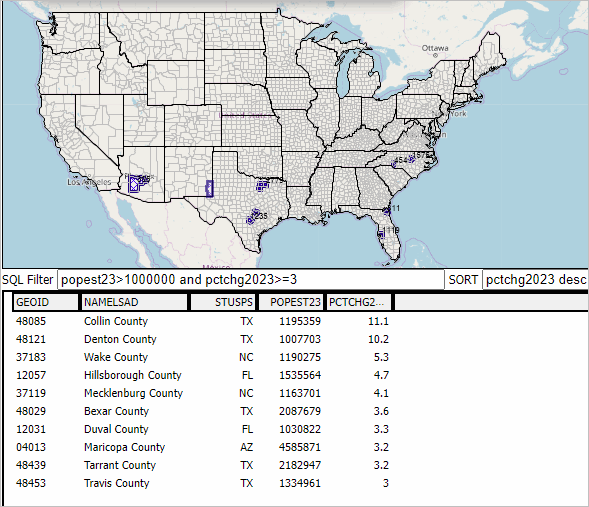
Category Archives: Counties

Population Living Alone & Age 65 Years and Over

.. how many people are living alone in your community, neighborhood? How does this population impact the community? What are their special needs? How does this population vary by area and population group? There were 37.9 million one-person households, 29% of all U.S. households in 2022. In 1960, single-person households represented only 13% of all households. These estimates are based on the 2022 Current Population Survey (CPS). Moving forward, the number of one-person households, people living alone, will increase at the rate of one million or more per year. People in households exclude people living in group quarters. This post examines patterns of people living alone with focus on people living alone age 65 year and over and distribution by small area geography.

While the CPS data provide a current snapshot of the number of people living alone, we have to use data from the American Community Survey to obtain data for smaller area geography like counties and census tracts.

Population Living Alone by Census Tract –Visual Data Analytics
The four graphics below show patterns of the population living alone by census tract. These views have been developed using the Visual Data Analytics (VDA GIS) tools with integrated demographics. Develop variations on these views using the VDA Web GIS using only a web browser.

Patterns of Population Living Alone by Tract

.. click graphic for larger view.

Patterns of Population 65 and Over Living Alone by Tract

.. click graphic for larger view.

Patterns of Population Living Alone by Tract — Houston Metro Area

Patterns of Population 65 and Over Living Alone by Tract — Houston Metro Area

Examine the Data in More Detail
As noted in this related New York Times story, nearly 26 million Americans 50 or older now live alone, up from 15 million in 2000. Older people have always been more likely than others to live by themselves makes up a bigger share of the population than at any time in the nation’s history. The trend has also been driven by deep changes in attitudes surrounding gender and marriage. People 50-plus today are more likely than earlier generations to be divorced, separated or never married. Similar ACS data as used to develop the graphics shown above are available by race/origin. These data are based on the ACS 2020 data; the same scope of data will be available from ACS 2021 to be released in December 2022.

About VDA GIS
VDA Web GIS is a decision-making information resource designed to help stakeholders create and apply insight. Use VDA Web GIS with only a Web browser; nothing to install; GIS experience not required. VDA Web GIS has been developed and is maintained by Warren Glimpse, ProximityOne (Alexandria, VA) and Takashi Hamilton, Tsukasa Consulting (Osaka, Japan).

About the Author
Warren Glimpse is former senior Census Bureau statistician responsible for national scope statistical programs and innovative data access and use operations. He is also the former associate director of the U.S. Office of Federal Statistical Policy and Standards for data access and use. He has more than 20 years of experience in the private sector developing data resources and tools for integration and analysis of geographic, demographic, economic and business data. Join Warren on LinkedIn.

Personal Economic Well-Being

.. examining characteristics, patterns and change in personal economic well-being; learning about what per capita personal income by county tells us. Per capita personal income (PCPI) is the best single measure of personal economic well-being. PCPI differs American Community Survey (ACS) measure of per capita income, median household income and similar income measures as PCPI includes non-monetary income .. PCPI provides a more comprehensive measure. This post provides an update focused on new data released November 2022, county level personal income time series data starting in 1969.

Patterns of 2021 Per Capita Personal Income by County

.. click graphic for larger view
.. use VDA Web GIS for Web-based interactive viewing/analytics.
.. see this more detailed analytical framework for analytics using VDA Desktop.

Importance of these Data
How is the regional economy doing? How is it trending? What policies might be changed to improve personal economic well-being? Answers to these and similar questions are why knowing about personal income and its derivation, components is important — to residents, businesses and governments. While median household income is often considered the best measure of buying power for an area, it is not the best measure of personal or household economic well-being. PCPI and the Regional Economic Information System provides insights and answers to these questions.

U.S. Change in PCPI
In U.S. metropolitan areas, PCPI increased 7.3 percent in 2021, up from 6.0 percent in 2020. In U.S. nonmetropolitan areas, PCPI increased 7.5 percent, down from 7.9 percent.

Regional Economic Information System
PCPI is a small part of the broader Regional Economic Information System (REIS). The following links show examples of detailed tables for Harris County, TX comparing 2019 and 2021 developed using the ProximityOne REIS package. Develop these profiles for any county for your selected year 1970 through 2021.
  • Personal Income by Major Source
  • Earnings by Source & Sector
  • Employment by Type & Sector
  • Transfer Payments
  • Economic Profile
  • Farm Income & Expenditures

About VDA GIS
VDA Web GIS is a decision-making information resource designed to help stakeholders create and apply insight. Use VDA Web GIS with only a Web browser; nothing to install; GIS experience not required. VDA Web GIS has been developed and is maintained by Warren Glimpse, ProximityOne (Alexandria, VA) and Takashi Hamilton, Tsukasa Consulting (Osaka, Japan).

About the Author
Warren Glimpse is former senior Census Bureau statistician responsible for national scope statistical programs and innovative data access and use operations. He is also the former associate director of the U.S. Office of Federal Statistical Policy and Standards for data access and use. He has more than 20 years of experience in the private sector developing data resources and tools for integration and analysis of geographic, demographic, economic and business data. Join Warren on LinkedIn.

Naturally Occurring Retirement Communities in Path of Hurricane Ian

.. 25.8 million U.S. households had a head of household age 65 years or over in 2010; 22.1% of total households. 3.1 million households with head of household 65 years or over were located in 10,201 “naturally occurring retirement communities” (NORCs) — areas where the percent of head of household age 65 or over is 40 percent or more. Has the number of NORCs tripled by now? Where and how much .. a next blog.

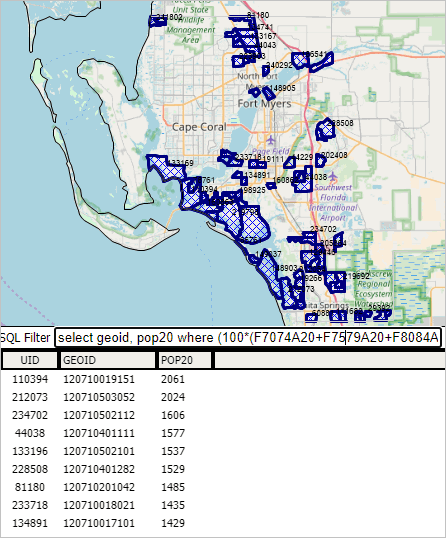
Here, we review Naturally Occurring Retirement Communities in the Path of Hurricane Ian by block group (BGs) in Lee County, FL … using VDA Web GIS. The same process can be applied to any area.

The following view shows a map view of the BGs meeting the criteria. A partial list of the BGs are shown in the table below the map. In the graphic, BGs meeting the criteria show with blue cross-hatch. Zoom in, label, get a profile if viewing real-time. In the graphic, for example, BG 120710019151 (state 12, county 171, tract 001951, BG code 1) has a total Census 2020 population of 2,061.

vda_lee_norc_bgs

Step-by-Step Guide
See this VDA Web GIS tutorial showing how to develop a similar view for areas of interest.

About VDA Web GIS
VDA Web GIS is a decision-making information resource designed to help stakeholders create and apply insight. VDA Web GIS has been developed and is maintained by Warren Glimpse, ProximityOne (Alexandria, VA) and Takashi Hamilton, Tsukasa Consulting (Osaka, Japan).

About the Author
Warren Glimpse is former senior Census Bureau statistician responsible for national scope statistical programs and innovative data access and use operations. He is also the former associate director of the U.S. Office of Federal Statistical Policy and Standards for data access and use. He has more than 20 years of experience in the private sector developing data resources and tools for integration and analysis of geographic, demographic, economic and business data. Join Warren on LinkedIn.

Examining Age/Gender Distributions with Population Pyramids

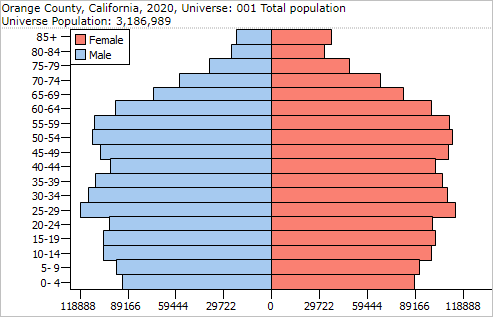
Population pyramids provide a data visualization often used in demographic analysis because they provide a condensed but powerful illustration of a population’s age distribution by gender. You can use the ChartGraphics tool to create population pyramids for the U.S., states, counties and other areas as reviewed in this section. For example, examine Census 2020 population by 5-year age group by gender for your area of interest.

A population pyramid is essentially two bar charts, one for the male population on the left and the other for the female population on the right. The base of the pyramid, or bottom of the chart, has the youngest population (ages 0-4) and the top has the oldest (ages 85 and older). The following pyramids illustrate how Orange County, CA has changed from 2000 to 2020.


.. click here to view above graphic and table.


.. click here to view above graphic and table.

About the Author
Warren Glimpse is former senior Census Bureau statistician responsible for national scope statistical programs and innovative data access and use operations. He is also the former associate director of the U.S. Office of Federal Statistical Policy and Standards for data access and use. He has more than 20 years of experience in the private sector developing data resources and tools for integration and analysis of geographic, demographic, economic and business data. Join Warren on LinkedIn.

Arizona’s Shifting Demographics

.. part of a state-by-state series .. these periodic posts examine how and why the state and its counties changed bwteen 2010 and 2020. Later posts will provide more of a drill-down look at change. Click the Follow link at right to receive new and updated information.

Census 2020 Arizona Demographics
The Arizona July 1, 2020 Census model-based population estimate of 7,421,401 compares to the Census 2020 population count of 7,151,502 people. The difference of -269,899 between the 2020 estimate and the 2020 count can be explained by several factors. First, the estimate is for a point in time that is three months later that the Census. There will be a tendency of the Census Bureau to adjust the Joly 1, 2020 population estimate to conform to the Census 2020 value. The July 1, 2020 estimate will likely be adjusted to reflect this change when the July 1, 2021 estimates are released April/May of 2022.

The 2020 population estimate is determined using a component method. The 2020 population estimate is the sum of the 2019 population estimate (7,291,843 for Arizona) and each of the following for the period July 1, 2019 through June 30, 2020 …
plus births (AZ 81,451)
less deaths (AZ 66,385)
plus international migration (AZ 9,272)
plus domestic migration (AZ 105,435)
plus an estimation residual (AZ -214)

Any one or a combination of these 6 estimate based values could be wrong, or the Census 2020 value could be wrong. It is likely a combination of all of these factors.

The remainder of this section is based on Census Bureau model-based estimates, released April 26, 2021. See more about these data for all U.S. counties in the Demographics 2060 section where Arizona demographic projections can be examined.

Visualizing Arizona Demographic Change
The following graphic illustrates how Arizona county demographics have changed from 2010 to 2020. The labels show the actual percent change; the color patterns, as shown in the legend, provide a visual thematic pattern view.

Examining the How and Why of Demographic Change
The following table shows a row for the state and each county, providing more detail as to the where, what/how much, how and why demographic change has occurred from 2010 to 2020.


Click graphic for larger view.

Looking Ahead
More geographically detailed data (counties for example) based Census 2020 (August 2021) will reveal much starker percentage differences between the 2020 estimates versus Census results. The ProximityOne annual estimates and projections to 2060 are developed using two basic series (and variation among those (low, base, high): Census 2020 based series and 2020 estimates series. See http://proximityone.com/demographics2060 for details.

Learn more — Join me in the Data Analytics Web Sessions
Join me in a Accessing & Using GeoDemographics Web Session where we discuss topics relating to measuring and interpreting the where, what, when, how and how much demographic-economic change is occurring and it’s impact.

About the Author
— Warren Glimpse is former senior Census Bureau statistician responsible for national scope statistical programs and innovative data access and use operations. He is also the former associate director of the U.S. Office of Federal Statistical Policy and Standards for data access and use. He has more than 20 years of experience in the private sector developing data resources and tools for integration and analysis of geographic, demographic, economic and business data. Contact Warren. Join Warren on LinkedIn.

Business Establishment Characteristics by County

.. what are the number and types of businesses underlying county economies of interest? What is the employment size by type of business establishment? What scope of wages, earnings do they contribute? Learn more here.

The pandemic impact on businesses remains in flux .. this post tools and data that can be used to examine pre-pandemic business establishments and employment pattern characteristics by county. By examining pre-pandemic conditions, we can better assess the impact of how and why business, demographic and economic change and impact as we move forward. The magnitude and duration of the impact on businesses will vary by community/area and become more measurable in the months ahead. The “How & Where of Business Establishment/Employment Change” will be updated later in 2020. See related, more detailed web section. See related section focused business establishments by ZIP code.

Where Things are Made by County
The following graphic shows patterns of the number of manufacturing establishments (NAICS 31) by county for the U.S. 48 contiguous states. Inset legend in map view shows number of establishments by interval/color. View/examine all U.S. states and areas using the related GIS project. Create custom maps similar to this view for your regions of interest depicting establishments, employment or payroll for your type of business selection(s). Click graphic for larger view with more detail; expand browser window for best quality view.

– view developed with ProximityOne CV XE GIS software and related GIS project.

The above view shows patterns for only one type of business. Data are tabulated more than 2,000 NAICS/type of business codes. These data may be examined by county using the interactive table. Use the GIS tools and related GIS project to develop variations of the views shown here.

Using the Interactive Table
The 10 largest counties based on the number of manufacturing establishments are shown in the static graphic below. Click for larger view.

Use the interactive table to dynamically create similar rankings on employment size or payroll. Set a query for a county, metro or state of interest.

Updates
These data update in June 2020. Follow the blog (click button at upper right) to receive updates.

Learn more — Join us in the Situation & Outlook Web Sessions
Join me in a Situation & Outlook Web Session where we discuss topics relating to measuring and interpreting the where, what, when, how and how much demographic-economic change is occurring and it’s impact.

About the Author
— Warren Glimpse is former senior Census Bureau statistician responsible for innovative data access and use operations. He is also the former associate director of the U.S. Office of Federal Statistical Policy and Standards for data access and use. He has more than 20 years of experience in the private sector developing data resources and tools for integration and analysis of geographic, demographic, economic and business data. Contact Warren. Join Warren on LinkedIn.

How & Why County Demographics are Changing

.. the pandemic impact on population change remains in flux. For many counties it will impact each component of population change: births, deaths and migration. The magnitude and duration of the impact on each component will vary by county and become more measurable in the months ahead. The “How & Why County Demographics are Changing” will be updated later in 2020.

Here we look at population and components of change by county for the period 2010 to 2019 .. tools and data to examine how the U.S. by county population is changing. These latest 2019 estimates were released this spring. See more in the related web section.

Top 25 Counties with Largest Population Change 2010-2019
Create a table similar to the one shown below using the interactive table. Sort on selected criteria and within a selected state or metro.

Patterns of Population Change by County, 2010-2019
The following graphic shows how counties have gained population (blue and green) and lost population (orange and red) during the period 2010 to 2019. Click graphic for larger view; expand browser window for best quality view.

.. view developed with ProximityOne CV XE GIS and related GIS project.

Examining Population Components of Change
Population change can be examined in terms of components of change. There are three components of change: births, deaths, and migration. The change in the population from births and deaths is often combined and referred to as natural increase or natural change. Populations grow or shrink depending on if they gain people faster than they lose them. Examining a county’s unique combination of natural change and migration provides insights into why its population is changing and how quickly the change is occurring. The above graphic shows these relationships.

County Population & Components of Change 2010-2019 – Interactive Table
View/analyze county population and components of change characteristics and trends in a tabular manner using the interactive table. The following static graphic shows net migration 2010-2019 by year for Houston, TX metro component counties. Rows have been ranked in descending order based on 2010 population. It is easy to see how the net migration in Harris County has been decreasing annually since 2015.

Try it yourself. Use the interactive table to examine counties/areas of interest.

Situation & Outlook Web Sessions
Join me in a Situation & Outlook Web Session where we discuss topics relating to measuring and interpreting the where, what, when, how and how much demographic-economic change is occurring and it’s impact.

About the Author
— Warren Glimpse is former senior Census Bureau statistician responsible for innovative data access and use operations. He is also the former associate director of the U.S. Office of Federal Statistical Policy and Standards for data access and use. He has more than 20 years of experience in the private sector developing data resources and tools for integration and analysis of geographic, demographic, economic and business data. Contact Warren. Join Warren on LinkedIn.

American Community Survey 2018: Geography & Access

.. there are 519 core-Based Statistical Areas (metros & micros) included as American Community Survey (ACS) 2018 tabulation areas. 2018 demographic-economic estimates are included for these and many other types of political/statistical areas — the subject of this section. This is the first in a series of posts about accessing, integrating and using the ACS 2018 data. Learn more about effective ways to use these and related data. See the main web section for more detail and access to the interactive table. The release date for the ACS 2018 data is September 26, 2019.

ACS 2018 1-year Tabulation Areas: 519 Core-Based Statistical Areas
— MSAs and MISAs

– view developed using ProximityOne CV XE GIS and related GIS project.
– geospatial analyze ACS 2018 1 year estimates integrated with your data to examine patterns; gain insights.

The 2018 American Community Survey (ACS 2018 main) is a nationwide survey designed to provide annually updated demographic-economic data for national and sub-national geography. ACS provides a wide range of important data about people and housing for every community across the nation. The results are used by everyone from planners to retailers to homebuilders and issue stakeholders like you. ACS is a primary source of local data for most of the 40 topics it covers, such as income, education, occupation, language and housing.

Determining What Data are Tabulated
The graphics below illustrate 1) the scroll section that lists the types of tabulation areas (summary levels) and 2) use of the interactive table to display a selection of CBSAs/metros (summary level 310).

ACS 2018 1-Year Summary Levels
The scroll section (see in web page) shows the summary level code (left column), part or component if applicable and summary level name.

ACS 2018 1-Year Estimates — Areas Published — Interactive Table
The interactive table (click link to view actual interactive table) enables you to list the geographic areas tabulated. This graphic shows CBSAs (MSAs and MISAs) tabulated. GeoID1 shows the unique tabulation area geocode for an area among all areas. GeoID1 inlcudes the summary level (first 3 characters), followed by state FIPS code where applicable, ‘US’ and finally the geocode for the specific area.

Demographic-Economic Analytics Web Sessions
Join me in a Demographics Analytics Lab session to discuss more details about accessing and using wide-ranging demographic-economic data and data analytics. Learn more about using these data for areas and applications of interest.

About the Author
— Warren Glimpse is former senior Census Bureau statistician responsible for innovative data access and use operations. He is also the former associate director of the U.S. Office of Federal Statistical Policy and Standards for data access and use. He has more than 20 years of experience in the private sector developing data resources and tools for integration and analysis of geographic, demographic, economic and business data. Contact Warren. Join Warren on LinkedIn.

The Local Area Monthly Employment Situation

.. in June 2019, the local area unemployment rate ranged from 1.3% (Lyon County, IA) to 19.6% (Yuma County, AZ) among the lower 48 states. 133 counties had an unemployment rate of 7% or more during June 2018 through June 2019. Over the past year, as shown in the this interactive table, the unemployment rate has generally decreased among all counties. We track the local area employment situation historically and develop alternative scenario projections. See the related Web page for more information.

Patterns of Unemployment Rate by County
The following graphic shows patterns of the estimated June 2019 unemployment rate by county. Use the GIS tools and data to develop variations of this view optionally integrated with other data. Click graphic for larger view. Expand browser window for best quality view.

— view created using the ProximityOne CV XE GIS and associated GIS Project

Examine Areas of Interest
This graphic illustrates the monthly over the year employment situation for the Houston, TX metro using the interactive table.

Click graphic for larger view.

Create a similar table for any metro:
Open the interactive table (green and white table midway down).
Click ShowAll button below table.
Key in a 5-character metro code in edit box at right of FindCBSACode.
    … get from scroll list at upper right of table.
    … e.g., 19100 for Dallas, TX metro.
Click FindCBSACode; table refreshes showing only counties in this metro.
Click Current Situation button below table; table refreshes with selected columns.
Click the Pop2018 column header cell twice to rank-order the columns.
Done .. try these steps for an area of interest.

Demographic-Economic Analytics Web Sessions
Join me in a Demographics Analytics Lab session to discuss more details about accessing and using wide-ranging demographic-economic data and data analytics. Learn more about using these data for areas and applications of interest.

About the Author
— Warren Glimpse is former senior Census Bureau statistician responsible for innovative data access and use operations. He is also the former associate director of the U.S. Office of Federal Statistical Policy and Standards for data access and use. He has more than 20 years of experience in the private sector developing data resources and tools for integration and analysis of geographic, demographic, economic and business data. Contact Warren. Join Warren on LinkedIn.

Visualizing Metro Area Geography

.. metropolitan areas are referred to as CBSAs (Core-Based Statistical Areas) and formally defined as sets of contiguous counties for the Federal Statistical System by OMB based largely on Census Bureau data.  More than 93-percent of the U.S. population live in CBSAs. This post presents three map graphics showing the geographic configuration of CBSAs and related CSAs (Combined Statistical Areas) — groupings of contiguous CBSAs that meet certain criteria. See related Web section for more detail.

The graphics below use the September 2018 CBSA vintage, the current and likely to be used for Census 2020 tabulations. These CBSAs are comprised of 392 Metropolitan Statistical Areas (MSAs), 384 MSAs in the U.S. and 8 in Puerto Rico, and 546 Micropolitan Statistical Areas (MISAs), 542 in the U.S. and 4 in Puerto Rico. For those MSAs that qualify, 11 MSAs are subdivided into 31 Metropolitan Divisions (MDs).

Metro Demographic-Economic Insights. What are the demographic characteristics of metros, how are they changing? We have developed annual population and population components of change estimates for the September 2018 vintage CBSAs.  Access these data in this interactive table. View CBSA county components. These data are integrated with other data to develop wide-ranging demographic-economic current estimates and projections for CBSAs and other geography (Situation & Outlook).

Metropolitan Statistical Areas, Sep 2018 Vintage
The following graphic shows the 2018 vintage Metropolitan Statistical Areas (MSAs). Use the associated GIS project to examine different years or subject matter items. Click graphic for larger view showing combined MSAs and MISAs.
Expand browser window for best quality view.


.. view developed with ProximityOne CV XE GIS and related GIS project.
.. create other views, geospatially analyze your data with associated GIS project.

Micropolitan Statistical Areas, Sep 2018 Vintage
The following graphic shows the 2018 vintage Micropolitan Statistical Areas (MISAs). Use the associated GIS project to examine different years or subject matter items. Click graphic for larger view showing combined MSAs and MISAs. Expand browser window for best quality view.


.. view developed with ProximityOne CV XE GIS and related GIS project.
.. create other views, geospatially analyze your data with associated GIS project.

Combined Statistical Areas, Sep 2018 Vintage
The following graphic shows the 2018 vintage Combined Statistical Areas (CSAs).
CSAs are contiguous CBSAs that are combined to form a CSA when certain conditions are met. Use the associated GIS project to examine different years or subject matter items. Click graphic for larger view showing CSAs with county overlay (visually determining which counties are in a CSA). Expand browser window for best quality view.


.. view developed with ProximityOne CV XE GIS and related GIS project.
.. create other views, geospatially analyze your data with associated GIS project.

DemographicEconomic Analytics Web Sessions
Join me in a Demographics Analytics Lab session to discuss more details about accessing and using wide-ranging demographic-economic data and data analytics. Learn more about using these data for areas and applications of interest.

About the Author
— Warren Glimpse is former senior Census Bureau statistician responsible for innovative data access and use operations. He is also the former associate director of the U.S. Office of Federal Statistical Policy and Standards for data access and use. He has more than 20 years of experience in the private sector developing data resources and tools for integration and analysis of geographic, demographic, economic and business data. Contact Warren. Join Warren on LinkedIn.