Monthly Archives: February 2017

Accessing & Using ZIP Code Demographics

.. tip of the day .. a continuing weekly or more frequent tip on developing, integrating, accessing and using geographic, demographic, economic and statistical data. Join in .. tip of the day posts are added to the Data Analytics Blog on an irregular basis, normally weekly. Follow the blog to receive updates as they occur.

… February 2017 updates .. 5 ways to access/analyze the most recent estimates of median housing value and other subject matter by ZIP Code area .. updates on accessing/downloading/using American Community Survey (ACS1115) 5-year estimates. See more detail in related Web section.

Site analysis (Option 5 below)
– create site analysis profiles from a location/ZIP code.

Contents
Five data access and use options, listed in the links below, are reviewed. Each method illustrates how ZIP code demographic-economic data can be accessed/ analyzed/used in different contexts. The most basic data access/data download is illustrated in Option 3. The following links open new windows that take you to the related section with more detail.
Option 1 – View the data as a thematic pattern map.
Option 2 – View, compare, rank query data in interactive tables.
Option 3 – Access data using API Tools; create datasets.
.. Option 3a – Extended ZIP Code subject matter access.
.. Option 3b – ZIP code urban/rural data access.
.. Option 3c – Additional API ACS data access resources.
Option 4 – View $MHI in structured profile in context of related data.
Option 5 – Site analysis – view circular area profile from a location.

Related ZIP Code Data Access & Use sections
Interactive access to demographics based on an address
Summary of ZIP Code Data Resources & Tools
10 Reasons to use Census Tracts Versus ZIP Codes
Analyzing Census Tract Demographics by ZIP Code Area
ZIP Code to Census Tract Equivalence Table
ZIP Code Urban/Rural Geography & Demographics
Mapping ZIP Code Demograhics
Housing Price Index by 5-digit ZIP Code – time series; annual updates
Housing Price Index by 3-digit ZIP Code – time series; quarterly updates
ZIP Code Business Establishment, Employment & Earnings by industry
ZIP Code Retail Trade Establishment & Sales by industry
ZIP Code Equivalence Tables — ZIP Code to School District

Join me in a Data Analytics Lab session to discuss more details about accessing and using wide-ranging demographic-economic data and data analytics. Learn more about using these data for areas and applications of interest.

About the Author
— Warren Glimpse is former senior Census Bureau statistician responsible for innovative data access and use operations. He is also the former associate director of the U.S. Office of Federal Statistical Policy and Standards for data access and use. He has more than 20 years of experience in the private sector developing data resources and tools for integration and analysis of geographic, demographic, economic and business data. Contact Warren. Join Warren on LinkedIn.

Housing Value Appreciation by 3-Digit ZIP Code: 2015Q3-2016Q3

.. tools, data and methods to examine housing value appreciation from 2015Q3 to 2016Q3 by 3-digit ZIP code based on the Housing Price Index (HPI).  How is the housing value changing in areas of interest?  How does housing value appreciation compare among a set of ZIP codes? Which ZIP code areas have the highest and lowest housing value appreciation in a state, region custom defined areas of interest? The HPI is calculated in part using home sales price information from Fannie Mae- and Freddie Mac-acquired mortgages. The U.S. all transactions HPI rose 5.6 percent from the 3rd quarter of 2015 to the 3rd quarter of 2016. Rank, compare, evaluate quarterly or annual housing value change for the approximate 900 3-digit ZIP code areas using the interactive table.

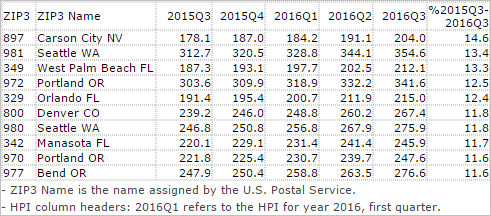
3-Digit ZIP Codes with Highest Housing Value Appreciation
Derived from the interactive table below this table shows the ten 3-digit ZIP codes having the highest housing value appreciation over the year 2015Q3-2016Q3. The areas are ranked on percent HPI change (rightmost column).

Gaining Insights in Housing Prices, Conditions & Markets
.. data, tools and methods to assess characteristics, patterns & trends
.. weekly Housing Data Analytics Lab sessions

Patterns of Housing Value Change by 3-Digit ZIP Code
The following graphic shows housing value appreciation 2015Q3-2016Q3 by 3-digit ZIP code based on the HPI. Use related GIS tools to zoom-in, assign labels, show in context with other geography.

– view developed using CVGIS and related GIS project.
– Click graphic for larger view and details;

Examining Housing Appreciation by 3-Digit ZIP Code
Use the interactive table below to view/rank/compare the non-seasonally adjusted “all transactions” HPI for the most recent 5 quarters for all 3-digit ZIP codes. The ranking table shows the latest quarterly HPI data and preceding quarters for one year earlier. This table will be updated on February 24, 2017, with 4th quarter 2016 data and related prior quarterly estimates and re-computed quarterly change values (last column).

Using the Interactive Table
The following graphic illustrates use of the HPI by 3-digit ZIP code interactive table. HPI data are shown for the quarterly period 2015Q3 through 2016Q3. The state selection below the table has been used to select only California ZIP codes. The Group1 button below the table has been used to select ZIP codes with a 2016Q3 HPI value of 175 ore more. The table is then sorted on the rightmost column. The resulting view shows that among all California 3-digit ZIPs having an HPI of 175 or more in 2016Q3, ZIP code 948/Richmond CA had the highest housing value appreciation — a 10.6% increase over the year.

Use the interactive table to examine states or ZIP code groups of interest.

Join me in a Data Analytics Lab session to discuss more details about accessing and using wide-ranging demographic-economic data and data analytics. Learn more about using these data for areas and applications of interest.

About the Author
— Warren Glimpse is former senior Census Bureau statistician responsible for innovative data access and use operations. He is also the former associate director of the U.S. Office of Federal Statistical Policy and Standards for data access and use. He has more than 20 years of experience in the private sector developing data resources and tools for integration and analysis of geographic, demographic, economic and business data. Contact Warren. Join Warren on LinkedIn.