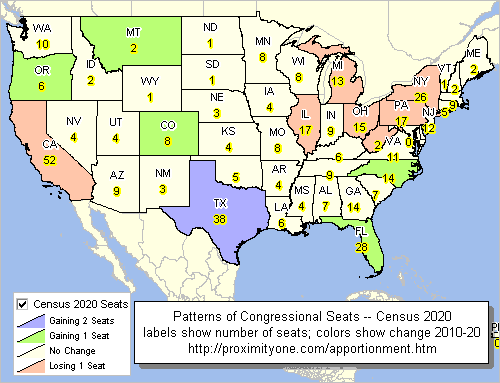
.. the first results of Census 2020, the apportionment data, were released on April 26, 2021. Based on the decennial census, the United States total resident population increased from 308,745,538 (2010) to 331,449,281 (2020), a change of 22,703,743 (7.3%). For now, these data should be trusted and assumed accurate. The apportionment data provide only total population counts at the state level. More will be revealed about the accuracy of these data when the redistricting data are released in August 2021.
Apportionment of the U.S. House of Representatives
Congressional apportionment is the process of dividing the 435 members, or seats, in the House of Representatives among the 50 states based on the population data from the decennial census. See more about congressional districts and demographic-economic characteristics. See this related web section for detailed information on apportionment. Use the interactive table to view/analyze the Census 2010 and Census 2020 apportionment data. The following view shows patterns of congressional seats based on the decennial census. Labels show the number of seats based on the 2020 Census. Color patterns show the change in seats, 2010 to 2020. 
Census 2020: the Process & Challenges
Counting the total population and selected population attributes in a pandemic is not only challenging but not possible. During 2020, as the data were collected, it seemed good news that more than two-thirds of the potential respondents had completed the questionnaire. But then the questions set in. Bureau public announcements frequently made reference to the number or housing units and the number of households (occupied housing units) “accounted for” reaching 90 percent and progressively more. By observation, using administrative record data, and other methods, housing units can be much more easily counted than the population and population attributes. Likewise, determining the number households is easier than determining the population count and characteristics.
The fact that the state population counts were unexpectedly different from the Bureau’s model based estimates is troubling. We seek more assurance that the count of population and population characteristics — by location — are as represented by the apportionment data.
Census Bureau 2020 Model-Based Estimates
New Census Bureau sourced U.S. by county model-based population estimates by age/gender/race-origin as of July 1, 2020 will be released by the Bureau in May 2021. These estimates are independent of Census 2020 and make use of methods used annually throughout the 2010-2020 period. An upcoming blog will report on ProximityOne’s analysis of these estimates in comparison with the Census 2020 data.
ProximityOne Estimates & Projections to 2060
ProximityOne annual demographic estimates and projections 2010-2060 by county will begin a new update cycle in May 2021. The schedule is shown here.
Starting with the May updates, two base projection series will be developed and progressively updated: one controlled to the Census 2020 data and one based on continued use of 2020 model-based estimates. As more information is released from Census 2020. Follow this blog for more information on evolving developments.
Learn more — Join me in the Data Analytics Web Sessions
Join me in a Accessing & Using GeoDemographics Web Session where we discuss topics relating to measuring and interpreting the where, what, when, how and how much demographic-economic change is occurring and it’s impact.
About the Author
— Warren Glimpse is former senior Census Bureau statistician responsible for national scope statistical programs and innovative data access and use operations. He is also the former associate director of the U.S. Office of Federal Statistical Policy and Standards for data access and use. He has more than 20 years of experience in the private sector developing data resources and tools for integration and analysis of geographic, demographic, economic and business data. Contact Warren. Join Warren on LinkedIn.


