Tag Archives: GIS

Measuring & Analyzing Households by Social Class by PUMA

.. a social class is a population or household group typically referred to as a lower, middle and upper class. The size of the population or households in a social class is often determined in relationship to an interval related to the median household income of an area — from two-thirds of median household income to twice the median household income (MHI). Subsequent blog posts will address a broader definition for class determination. By better understanding composition and determinants of social class for an area, we might better understand and improve on income inequality and create new opportunities. This is a multi-part blog post on social class analytics. Click Follow at right to receive updates.

Percent Population in Households by Social Class by PUMA
.. Los Angeles area .. click for larger view.

Los Angeles metro area by social class .. PUMAs shown with black boundaries; pointer at Los Angeles-Orange County line

Percent of Households by Social Class by PUMA
.. Los Angeles area .. click for larger view.

Los Angeles metro area by social class .. PUMAs shown with black boundaries; pointer at Los Angeles-Orange County line

Using American Community Survey Microdata
We use of the American Community Survey microdata or “public use microdata samples” (PUMS) http://proximityone.com/pums.htm to develop estimates of population and households by middle class, lower class and upper class by “public use microdata area” (PUMA) http://proximityone.com/puma.htm. Microdata files are comprised of anonymized individual respondent data within PUMAs. The approximate 2,800 PUMAs cover the U.S. wall-to-wall and must have 100,000 population or more. 2010 and 2020 vintages PUMAs may be examined and compared with other geography using the VDA Web GIS http://proximityone.com/vda.htm with the MetroDynamics Project.

Social Class Participation by PUMA
Using custom software, the PUMA (ACS 2021 1 year data in this case), individual housing records are summarized for each PUMA. An estimate is developed for the lower, middle and upper class based on an algorithm.

Examine patterns of social class stratification using VDA Web GIS anywhere in U.S.
The estimates are then integrated into a PUMA shapefile. The PUMA shapefile is added to a Geographic Information System (GIS). Access this shapefile/layers using VDA Web GIS to examine patterns of social class, such as the graphics shown above, or in combination with other geography and subject matter.

About VDA GIS
VDA Web GIS is a decision-making information resource designed to help stakeholders create and apply insight. Use VDA Web GIS with only a Web browser; nothing to install; GIS experience not required. VDA Web GIS has been developed and is maintained by Warren Glimpse, ProximityOne (Alexandria, VA) and Takashi Hamilton, Tsukasa Consulting (Osaka, Japan).

Data Analytics Web Sessions
Join us in the every Tuesday, Thursday Data Analytics Web Sessions. See how you can use VDA Web GIS and access different subject matter for related geography. Get your geographic, demographic, data access & use questions answered. Discuss applications with others.

About the Author
Warren Glimpse is former senior Census Bureau statistician responsible for national scope statistical programs and innovative data access and use operations. He is also the former associate director of the U.S. Office of Federal Statistical Policy and Standards for data access and use. He has more than 20 years of experience in the private sector developing data resources and tools for integration and analysis of geographic, demographic, economic and business data. Join Warren on LinkedIn.

118th Congressional District Demographic Characteristics

.. what are the geographic, demographic, economic characteristics of a congressional district of interest? What are peer group congressional districts based on these characteristics? How might coalitions on selected topics better evolve? How can you communicate more effectively on policy issues to your congressional district leadership? How can you vote in a more informed manner by better understanding these matters? Use the VDA Web GIS Congressional Districts project to get these answers using only a Web browser. Learn more about Geographic Information Systems (GIS). This is a multi-part blog post on congressional district analytics. Click Follow at right to receive updates.

The November 2022 elections determined the representatives for the 118th Congressional Districts (CDs). The 118th Congress is in session from January 2023 to December 2024. The 118th Congressional District boundaries reflect the redistricting process based on Census 2020 results. While CDs have about the same population size within a state, the demographic composition varies widely. Use the VDA Web GIS Congressional Districts project to examine CD demographic-economic characteristics. Selected highlights are reviewed below.

These illustrative thematic pattern maps are based on data from the American Community Survey 2021 1-year estimates. Create your own maps and perform geospatial analyses using the VDA Web GIS with the Congressional Districts project. Nothing to install. Access using a Web browser. Start here. Sign up and login. Select the Congressional Districts project.

General Demographics — Percent Majority-Minority
Examine general demographics characteristics like topics on age and race/origin.

Social Characteristics — Educational Attainment
Examine social characteristics like household composition, mobility, enrollment, educational attainment.

Economic Characteristics — Economic Prosperity
Examine economic characteristics like labor force attributes, employment by occupation industry, income and benefits.

Housing Characteristics — Housing Value
Examine housing characteristics like owner/renter, units in structure, year structure built, housing value, rent, housing cost burden.

What’s Ahead — Upcoming Congressional District Blog Posts
This section has introduced tools to examine congressional districts at the national/regional level. The same tools and Congressional District project can be used to drill-down to the neighborhood level. Examine how characteristics within a congressional district vary within the district .. to be covered in subsequent posts. Learn more about examining these data in a tabular manner and geospatial analysis.

Upcoming topics .. drill-down analytics like this illustrative view
.. Atlanta, GA area .. CDs bold boundary labeled with CD code.
.. patterns of economic prosperity (median household income) by census tract
.. pointer & Atlanta city in GA05
.. easy to see how GA05 and GA06 radically different

About VDA GIS
VDA Web GIS is a decision-making information resource designed to help stakeholders create and apply insight. Use VDA Web GIS with only a Web browser; nothing to install; GIS experience not required. VDA Web GIS has been developed and is maintained by Warren Glimpse, ProximityOne (Alexandria, VA) and Takashi Hamilton, Tsukasa Consulting (Osaka, Japan).

Data Analytics Web Sessions
Join us in the every Tuesday, Thursday Data Analytics Web Sessions. See how you can use VDA Web GIS and access different subject matter for related geography. Get your geographic, demographic, data access & use questions answered. Discuss applications with others.

About the Author
Warren Glimpse is former senior Census Bureau statistician responsible for national scope statistical programs and innovative data access and use operations. He is also the former associate director of the U.S. Office of Federal Statistical Policy and Standards for data access and use. He has more than 20 years of experience in the private sector developing data resources and tools for integration and analysis of geographic, demographic, economic and business data. Join Warren on LinkedIn.
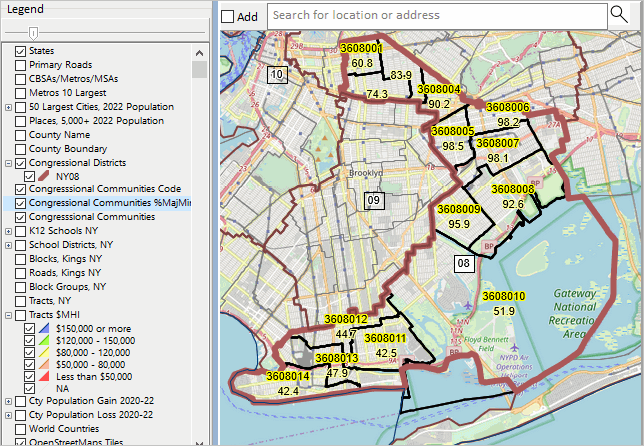
Examining City GeoDemographic Drilldown; Intersecting Tracts and Places

.. how can “our city” do a better job of providing housing for low-income individuals and families? One part of a successful program involves looking at attributes of the neighborhood, or census tract, geography across the city. We need to analyze needs by city component census tracts, areas averaging 4,000 population. Here is how that might be approached — determining which census tracts. And while this applies to low income housing, it applies to many other planning topics.

Relate census tract geography to city/place geography using GIS tools for analytical purposes … determine which tracts intersect a city/place. This section considers intersecting tracts and places for illustrative purposes. But the methodology, and tools to do this, involve many, many other types of geography .. geographic spatial intersection. The inputs in this case are U.S. national scope 2020 census tracts (85,190 areas covering the U.S. wall-to-wall) and U.S. national scope 2020 places (32,188 areas). The output from the process of intersecting these geographies are tract-place intersecting parts (119,906 areas). There are 32,146 tracts that are wholly contained in places.

Developing Intersect Files
Tracts intersecting with cities can be determined using the VDAGIS Intersect tool. Select the two input shapefiles and name the intersect output shapefile. The intersect shapefile is added to the GIS project being used.

Focusing on a City
What tracts intersect a city of interest? By having this information, stakeholders, policymakers can study and better understand inequities, differences and needs across the city. Consider Santa Ana, CA (Orange County). There are 65 tracts that intersect with the city of Santa Ana. This could be any city across America. The following view shows Santa Ana with intersecting tracts.

By viewing the intersecting file in VDAGIS, intersecting tracts can be examined. The graphic below shows a zoom-in to tract 06059089102 (blue boundary). This tract is shown at the pointer in the above graphic. in the following zoom-in view, the white label shows the tract code for the whole tract and the two split parts are shown with the same code. The part to the right in Santa Ana city, the part to the left is in Garden Grove city.

Using the intersecting file, the list (a partial list) of these tracts and tract codes can be determined as shown below. By knowing the tract codes, detailed demographic-economic data can be pulled using DEDE and tract characteristics can be studied. Inequities ab be examined, special needs can be determined, east versus west tract groups might identify patterns to facilitate collaboration and policy development. What are the patterns of affordable housing across the city?

About VDAGIS
VDA Web GIS is a decision-making information resource designed to help stakeholders create and apply insight. Use VDA Web GIS with only a Web browser; nothing to install; GIS experience not required. VDA Web GIS has been developed and is maintained by Warren Glimpse, ProximityOne (Alexandria, VA) and Takashi Hamilton, Tsukasa Consulting (Osaka, Japan).

About the Author
Warren Glimpse is former senior Census Bureau statistician responsible for national scope statistical programs and innovative data access and use operations. He is also the former associate director of the U.S. Office of Federal Statistical Policy and Standards for data access and use. He has more than 20 years of experience in the private sector developing data resources and tools for integration and analysis of geographic, demographic, economic and business data. Join Warren on LinkedIn.

The New Urban Geography

.. the nation’s urban population increased by 6.4% between 2010 and 2020 based on 2020 Census data and a change in the way urban areas are defined. As a result of these changes, 1,140 areas containing approximately 4.2 million people, classified as urban in 2010 are now rural. See more about the 2020 urban/rural geography/population. See more about the urban population.

Patterns of the New Urban Geography

click graphic for larger view

As of 2020, there are 2,613 Urban Areas in the U.S. with a combined Census 2020 population of 265,149,027 (80%). The remaining area is defined as rural with Census 2020 population of 66,300,254 (20%).
  • Use this interactive table to view, sort urban areas.
  • Use this interactive table to view, sort states by 2010/2020 urban/rural.

These Federal designated urban areas are comprised of densely settled core of census blocks that meet minimum housing unit density and/or population density requirements. This includes adjacent territory containing non-residential urban land uses. To qualify as an urban area, the territory identified according to criteria must encompass at least 2,000 housing units or a population of at least 5,000. Rural encompasses all population, housing, and territory not included within urban areas.

Importance of Urban/Rural Designations
Data users and researchers interested in analyzing data for urban and rural population and housing use urban area geostatistical data routinely updated by statistical agencies. Analysts use urban area data to study patterns of urbanization, suburban growth and development, and urban/rural land area change.

Larger Urban Areas form the nucleus of Core-Based Statistical Areas (metros). Many metro areas (one or more contiguous counties) contain large rural areas even though some consider metros as large cities. Importantly, they are not the same.

Various federal and state agencies use urban and rural definitions as the basis for their own urban and rural definitions and settlement classifications for use in tabulating and presenting statistical data. The National Center for Education Statistics uses the urban area definitions in its locale codes classification. The U.S. Department of Agriculture uses the urban area classification as the basis for various urban and rural classifications used to analyze and report on demographic and economic patterns in rural areas.

Other government agencies use Urban Area designations to determine program eligibility and in their funding formulas. The Federal Highways Administration uses urban areas of 50,000 or more population to establish Metropolitan Planning Organizations. For rural health programs, a clinic qualifies as a rural health clinic if it is located outside the boundaries of any urban area.

GeoSpatial Analysis of New Urban Geography
Use the VDA Web GIS to examine urban/rural area geographic, demographic and economic make-up and in context of other geography and subject matter.

Urban Areas in the Houston, TX Region

click graphic for larger view

About VDA GIS
VDA Web GIS is a decision-making information resource designed to help stakeholders create and apply insight. Use VDA Web GIS with only a Web browser; nothing to install; GIS experience not required. VDA Web GIS has been developed and is maintained by Warren Glimpse, ProximityOne (Alexandria, VA) and Takashi Hamilton, Tsukasa Consulting (Osaka, Japan).

About the Author
Warren Glimpse is former senior Census Bureau statistician responsible for national scope statistical programs and innovative data access and use operations. He is also the former associate director of the U.S. Office of Federal Statistical Policy and Standards for data access and use. He has more than 20 years of experience in the private sector developing data resources and tools for integration and analysis of geographic, demographic, economic and business data. Join Warren on LinkedIn.

Arizona’s Shifting Demographics

.. part of a state-by-state series .. these periodic posts examine how and why the state and its counties changed bwteen 2010 and 2020. Later posts will provide more of a drill-down look at change. Click the Follow link at right to receive new and updated information.

Census 2020 Arizona Demographics
The Arizona July 1, 2020 Census model-based population estimate of 7,421,401 compares to the Census 2020 population count of 7,151,502 people. The difference of -269,899 between the 2020 estimate and the 2020 count can be explained by several factors. First, the estimate is for a point in time that is three months later that the Census. There will be a tendency of the Census Bureau to adjust the Joly 1, 2020 population estimate to conform to the Census 2020 value. The July 1, 2020 estimate will likely be adjusted to reflect this change when the July 1, 2021 estimates are released April/May of 2022.

The 2020 population estimate is determined using a component method. The 2020 population estimate is the sum of the 2019 population estimate (7,291,843 for Arizona) and each of the following for the period July 1, 2019 through June 30, 2020 …
plus births (AZ 81,451)
less deaths (AZ 66,385)
plus international migration (AZ 9,272)
plus domestic migration (AZ 105,435)
plus an estimation residual (AZ -214)

Any one or a combination of these 6 estimate based values could be wrong, or the Census 2020 value could be wrong. It is likely a combination of all of these factors.

The remainder of this section is based on Census Bureau model-based estimates, released April 26, 2021. See more about these data for all U.S. counties in the Demographics 2060 section where Arizona demographic projections can be examined.

Visualizing Arizona Demographic Change
The following graphic illustrates how Arizona county demographics have changed from 2010 to 2020. The labels show the actual percent change; the color patterns, as shown in the legend, provide a visual thematic pattern view.

Examining the How and Why of Demographic Change
The following table shows a row for the state and each county, providing more detail as to the where, what/how much, how and why demographic change has occurred from 2010 to 2020.


Click graphic for larger view.

Looking Ahead
More geographically detailed data (counties for example) based Census 2020 (August 2021) will reveal much starker percentage differences between the 2020 estimates versus Census results. The ProximityOne annual estimates and projections to 2060 are developed using two basic series (and variation among those (low, base, high): Census 2020 based series and 2020 estimates series. See http://proximityone.com/demographics2060 for details.

Learn more — Join me in the Data Analytics Web Sessions
Join me in a Accessing & Using GeoDemographics Web Session where we discuss topics relating to measuring and interpreting the where, what, when, how and how much demographic-economic change is occurring and it’s impact.

About the Author
— Warren Glimpse is former senior Census Bureau statistician responsible for national scope statistical programs and innovative data access and use operations. He is also the former associate director of the U.S. Office of Federal Statistical Policy and Standards for data access and use. He has more than 20 years of experience in the private sector developing data resources and tools for integration and analysis of geographic, demographic, economic and business data. Contact Warren. Join Warren on LinkedIn.

Census 2020 – First Results

.. the first results of Census 2020, the apportionment data, were released on April 26, 2021.  Based on the decennial census, the United States total resident population increased from 308,745,538 (2010) to 331,449,281 (2020), a change of 22,703,743 (7.3%). For now, these data should be trusted and assumed accurate.  The apportionment data provide only total population counts at the state level.  More will be revealed about the accuracy of these data when the redistricting data are released in August 2021.

Apportionment of the U.S. House of Representatives
Congressional apportionment is the process of dividing the 435 members, or seats, in the House of Representatives among the 50 states based on the population data from the decennial census. See more about congressional districts and demographic-economic characteristics. See this related web section for detailed information on apportionment. Use the interactive table to view/analyze the Census 2010 and Census 2020 apportionment data. The following view shows patterns of congressional seats based on the decennial census. Labels show the number of seats based on the 2020 Census. Color patterns show the change in seats, 2010 to 2020.

Census 2020: the Process & Challenges
Counting the total population and selected population attributes in a pandemic is not only challenging but not possible.  During 2020, as the data were collected, it seemed good news that more than two-thirds of the potential respondents had completed the questionnaire.  But then the questions set in.  Bureau public announcements frequently made reference to the number or housing units and the number of households (occupied housing units) “accounted for” reaching 90 percent and progressively more.  By observation, using administrative record data, and other methods, housing units can be much more easily counted than the population and population attributes.  Likewise, determining the number households is  easier than determining the population count and characteristics.

The fact that the state population counts were unexpectedly different from the Bureau’s model based estimates is troubling.  We seek more assurance that the count of  population and population characteristics — by location — are as represented by the apportionment data.

Census Bureau 2020 Model-Based Estimates
New Census Bureau sourced U.S. by county model-based population estimates by age/gender/race-origin as of July 1, 2020 will be released by the Bureau in May 2021.  These estimates are independent of Census 2020 and make use of methods used annually throughout the 2010-2020 period.  An upcoming blog will report on ProximityOne’s analysis of these estimates in comparison with the Census 2020 data.

ProximityOne Estimates & Projections to 2060
ProximityOne annual demographic estimates and projections 2010-2060 by county will begin a new update cycle in May 2021.  The schedule is shown here.  

Starting with the May updates, two base projection series will be developed and progressively updated: one controlled to the Census 2020 data and one based on continued use of 2020 model-based estimates. As more information is released from Census 2020. Follow this blog for more information on evolving developments.

Learn more — Join me in the Data Analytics Web Sessions
Join me in a Accessing & Using GeoDemographics Web Session where we discuss topics relating to measuring and interpreting the where, what, when, how and how much demographic-economic change is occurring and it’s impact.

About the Author
— Warren Glimpse is former senior Census Bureau statistician responsible for national scope statistical programs and innovative data access and use operations. He is also the former associate director of the U.S. Office of Federal Statistical Policy and Standards for data access and use. He has more than 20 years of experience in the private sector developing data resources and tools for integration and analysis of geographic, demographic, economic and business data. Contact Warren. Join Warren on LinkedIn.

New Monthly Residential Construction

.. staying ahead of how and where demographics are changing. Among all monthly new authorized residential construction permit issuing cities/places, Raleigh, NC led the U.S. with 1,749 total units followed by Austin, TX with 1,563 total units in February 2021. See more about this leading economic indicator for cities/places using interactive table below. Data on housing patterns and trends are essential for wide-ranging decision-making applications. Using ProximityOne resources to examine housing characteristics and trends ..

We post monthly and more frequent updates on what New Authorized Residential Construction data are telling us. The March 2021 city/county data will be released this week. Access the latest data for your areas of interest. Click the Follow button at right to keep up-to-date.

Monthly New Authorized Residential Construction
ProximityOne maintains a national monthly time-series database providing access to new authorized residential construction data.  The table presented below summaries key subject matter items available at the city and county level.. These data are one of eleven leading economic indicators. The housing market is often one of the first economic sectors to expand or contract when economic conditions improve or decline. With only a one month lag from reference data to availability date, these measures are early indicators of housing market change. This change typically leads to other types of economic change.

Patterns of New Residential Construction: February 2021; Phoenix Area
Using GIS tools to examine new authorized residential construction .. as an example, the following graphic shows that the City of Phoenix had 1,373 new authorized total units in February 2021. Cities/places shown with black outline.

View Most Month in Tabular Form
Use the interactive table to view these data in a tabular form as shown below.

Scope of Subject Matter
The database is updated monthly and contains monthly and annual data. The scope of subject matter is illustrated as shown below — the number of new units authorized and value by type of structure for Fresno County, CA.

Learn more — Join me in the Data Analytics Web Sessions
Join me in a Accessing & Using GeoDemographics Web Session where we discuss topics relating to measuring and interpreting the where, what, when, how and how much demographic-economic change is occurring and it’s impact.

About the Author
— Warren Glimpse is former senior Census Bureau statistician responsible for national scope statistical programs and innovative data access and use operations. He is also the former associate director of the U.S. Office of Federal Statistical Policy and Standards for data access and use. He has more than 20 years of experience in the private sector developing data resources and tools for integration and analysis of geographic, demographic, economic and business data. Contact Warren. Join Warren on LinkedIn.

Housing Value Appreciation

.. U.S. housing prices rose nationwide in August, up 1.5% from the previous month, based on the FHFA Housing Price Index (HPI). Housing prices rose 8.0% from August 2019 to August 2020.

If you purchased a housing unit in 2019Q2 at $260,200 (the ACS 2019 median housing value), the value of the unit in 2020Q2 would be $271,000, an increase of 4.2%. A good deal in this era of low interest rates.

U.S. housing prices posted a strong increase in August .. the 1.5% increase is the largest one-month price increase observed since the start of the HPI measurement in 1991. This large month-over-month gain contributes to an already strong increase in prices over the summer. These price gains can be attributed to the historically low interest rates, rebounding housing demand and continued supply constraints.

The HPI has various limitations as a measure to assess the housing market. One important limitation is that it a measure in isolation; other related demographic-economic measures are not included. This is unlike the American Community Survey (ACS) estimates of the median housing value ($MHV), used as an annual, year-over-year measure of housing value appreciation.

Median Housing Value
The U.S. ACS 1-year estimate of median housing value ($MHV) increased from $229,700 in 2018 to $240,500 in 2019. The ACS 2020 estimate, which will be impacted by the pandemic, will not be available until September 2021. The ProximityOne 2020 estimate of $MHV is $270,500.

Click this API link to view a CSV-like file showing the 2019 median household income and median housing value by state. Join me in a Data Analytics Web Session (see below) to integrate these data into a map view like shown below. Add other data.

Patterns of Median Housing Value by State

– view developed using ProximityOne CV XE GIS
– click graphic for larger view

An advantage of using the ACS or ACS-like $MHV data is that this measure is synchronized with other related measures, like total population, total housing units, housing units by tenure and age built and so on. Though a popular measure to assess geographically comparable housing values, the $MHV has many limitations. A key limitation is that few survey responders really know the value of their home. Other limitations have to do with the definition itself and how the data are collected/developed. ACS $MHV measures value of only occupied housing units and excludes houses on 10 or more acres and housing units in multi-unit structures. See more. While there are other Federal sources of $MHV, it remains that the usabilty aspects of the ACS or ACS-like measures are second to none.

Learn more — Join me in the Situation & Outlook Web Sessions
Join me in a Situation & Outlook Web Session where we discuss topics relating to measuring and interpreting the where, what, when, how and how much demographic-economic change is occurring and it’s impact.

About the Author
— Warren Glimpse is former senior Census Bureau statistician responsible for national scope statistical programs and innovative data access and use operations. He is also the former associate director of the U.S. Office of Federal Statistical Policy and Standards for data access and use. He has more than 20 years of experience in the private sector developing data resources and tools for integration and analysis of geographic, demographic, economic and business data. Contact Warren. Join Warren on LinkedIn.

Tip of the Day – Examining Median Housing Value – 2020 Update

.. tip of the day .. a continuing weekly or more frequent tip on developing, integrating, accessing and using geographic, demographic, economic and statistical data. Join in .. tip of the day posts are added to the Data Analytics Blog on an irregular basis, normally weekly. Follow the blog to receive updates as they occur.

.. in this era of uncertainly, we ponder the risk and opportunity associated with changing housing value.  Median housing value by ZIP Code area is one metric of great interest to examine levels and change.  While only one measure useful to examine housing characteristics, it is part of a broader set of demographic-economic data that enable analysis of the housing infrastructure and change in a more wholistic manner. How is housing value trending at the neighborhood level in 2020 and beyond? See more about the Situation & Outlook.

.. 5 ways to access/analyze the most recent estimates of median housing value and other subject matter by ZIP Code area .. based on the American Community Survey (ACS) 5-year estimates. See related Web section.

Option 1. View the data as a thematic pattern map
Option 1 is presented as Option 1A (using CV XE GIS) and Option 1B (using Visual Data Analytics VDA Mapserver). See more about GIS.

Option 1A. View $MHV as a thematic pattern map; using CV XE GIS:
— Median Housing Value by ZIP Code Area; Los Angeles Area
Click graphic for larger view with more detail.

Click graphic for larger view.
Use the Mapping ZIP Code Demographics resources to develop similar views anywhere in U.S.

Option 1B. View $MHV (ACS 2018) as a thematic pattern map; using VDA Mapserver:
— Median Housing Value by ZIP Code Area; Phoenix/Scottsdale, AZ area
Click graphic for larger view with more detail.

Click graphic for larger view. Expand window to full screen for best quality view. View features:
– profile of ZIP 85258 (blue crosshatch highlight) shown in Attributes panel at left
– values-colors shown in Legend panel at left
– transparency setting allows “see through” to view ground topology below.
Use VDA Mapserver: to develop similar views anywhere in U.S. using only a browser. Nothing to install.

Option 2. Use the interactive table:
– go to http://proximityone.com/zip18dp4.htm (5-year estimates)
– median housing value is item H089; see item list above interactive table.
– scroll left on the table until H089 appears in the header column.
– that column shows the 2018 ACS H089 estimate for for all ZIP codes.
– click column header to sort; click again to sort other direction.
– see usage notes below table.

Option 3. Use the API operation:
– develop file containing $MHV for all ZIP code areas in U.S.
– load into Excel, other software; link with other data.
– median housing value ($MHV) is item B25077_001E.
click this link to get B25077_001E ($MHV) using the API tool.
– this API call retrieves U.S. national scope data.
– a new page displays showing a line/row for each ZIP code.
– median housing value appears on the left, then ZIP code.
– optionally save this file and import the data into a preferred program.
– more about API tools.
Extending option 3 … accessing race, origin and $MHV for each ZIP code …
click on these example APIs to access data for all ZIP codes
.. get extended subject matter for all ZIP codes
.. get extended subject matter for two selected ZIP codes (64112 and 65201)

Items used in these API calls:
.. B01003_001E – Total population
Age
.. B01001_011E — Male: 25 to 29 years (illustrating age cohort access)
.. B01001_035E — Female: 25 to 29 years (illustrating age cohort access)
Race/Origin
.. B02001_002E – White alone
.. B02001_003E – Black or African American alone
.. B02001_004E – American Indian and Alaska Native alone
.. B02001_005E – Asian alone
.. B02001_006E – Native Hawaiian and Other Pacific Islander alone
.. B02001_007E – Some other race alone
.. B02001_008E – Two or more races
.. B03001_003E – Hispanic (of any race)
Income
.. B19013_001E – Median household income ($)
.. B19113_001E – Median family income ($)
Housing & Households
.. B25001_001E – Total housing units
.. B25002_002E – Occupied housing units (households)
.. B19001_017E — Households with household income $200,000 or more
.. B25003_002E — Owner Occupied housing units
.. B25075_023E — Housing units value $500,000 to $749,999
.. B25075_024E — Housing units with value $750,000 to $999,999
.. B25075_025E — Housing units with value $1,000,000 or more
.. B25002_003E – Vacant housing units
.. B25077_001E – Median housing value ($) – owner occupied units
.. B25064_001E – Median gross rent ($) – renter occupied units

View additional subject matter options.

Option 4. View the $MHV in context of other attributes for a ZIP code.
Using – ACS demographic-economic profiles. Example for ZIP 85258:
General Demographics ACS 2018 .. ACS 2017
Social Characteristics ACS 2018 .. ACS 2017
Economic Characteristics ACS 2018 .. ACS 2017
Housing Characteristics ACS 2018 .. ACS 2017 .. $MHV shown in this profile.

Option 5. View 5- and 10-mile circular area profile from ZIP center.
– profile for ZIP 80204 dynamically made using SiteReport tool.
– with SiteReport running, enter the ZIP code, radii and click Run.
– comparative analysis report is generated in HTML and Excel structure.
Click this link to view resulting profile.
– from the profile, site 2 is 1.9 times the population of site 1.
– Site 1 $MHV is $296,998 compared to Site 2 $MHV $269,734.
– GIS view with integrated radius shown below.

This section is focused on median housing value and ZIP code areas. Many other subject matter items will be apparent when these methods are used. Optionally adjust above details to view different subject matter for ZIP codes.

Join me in a Data Analytics Lab session to discuss more details about accessing and using wide-ranging demographic-economic data and data analytics. Learn more about using these data for areas and applications of interest.

About the Author
— Warren Glimpse is former senior Census Bureau statistician responsible for innovative data access and use operations. He is also the former associate director of the U.S. Office of Federal Statistical Policy and Standards for data access and use. He has more than 20 years of experience in the private sector developing data resources and tools for integration and analysis of geographic, demographic, economic and business data. Contact Warren. Join Warren on LinkedIn.

VDA Mapserver: Comparing Census Tracts & ZIP Codes

.. for small area demographic-economic analysis, census tracts and ZIP code areas both have their advantages and disadvantages.  While the same scope of subject matter data are available from the American Community Survey (ACS) and ProximityOne current estimates and projections for these geographies, it can be difficult to view how the geographic areas visually relate or intersect in a map.  A flexible solution, accessible by any Web browser, is the Virtual Data Analytics (VDA) Mapserver.  See details.  You can start using VDA immediately with nothing to install.

Visual Data Analytics Mapserver
The VDA Mapserver is a learning resource, a tool that you can use for interactive mapping and geospatial analysis using only Internet and a browser. The VDA Mapserver is set apart from related tools due to the scope and style of accessing data for wide-ranging geography and frequently updated demographic-economic subject matter data. Use the unique combination of Federal statistical data with proprietary current estimates and projections.

Other geographies and subject matter will be reviewed in subject posts.

An Illustration: ZIP Code Area 85258, Scottsdale, AZ

– click for larger view.

The above shows a zoom-in to ZIP code area 85258 in Scottsdale, AZ. A step-by-by description of how to develop this view is shown in this section of the VDA guide.

As shown in the graphic, ZIP Code area 85258 intersects with 8 census tracts. ZIP code areas and tracts are not coterminous. On average there are approximately 2.5 tracts per ZIP code area. But there are more than 150,000 intersecting combinations of ZIP Code areas and tracts. See intersecting areas and interactive table.

Learn more — Join me in the Situation & Outlook Web Sessions
Join me in a Situation & Outlook Web Session where we discuss topics relating to measuring and interpreting the where, what, when, how and how much demographic-economic change is occurring and it’s impact.

About the Author
— Warren Glimpse is former senior Census Bureau statistician responsible for national scope statistical programs and innovative data access and use operations. He is also the former associate director of the U.S. Office of Federal Statistical Policy and Standards for data access and use. He has more than 20 years of experience in the private sector developing data resources and tools for integration and analysis of geographic, demographic, economic and business data. Contact Warren. Join Warren on LinkedIn.