.. voting district, or election precinct, demographics are typically hard to acquire, making analysis of voting districts a challenging task. Voting district analysis is of interest for many reasons. Voting districts are the lowest common denominator for most election areas — from city council to the U.S. House of Representatives. This section illustrates how voting district (VTD) geography can be examined in context of other geography and how voting district demographics can be analyzed using GIS resources. These applications make use of Fairfax County, VA,
part of the Washington, DC metro, but can be developed for most counties/areas across the U.S.
Voting Districts & Neighborhood Patterns
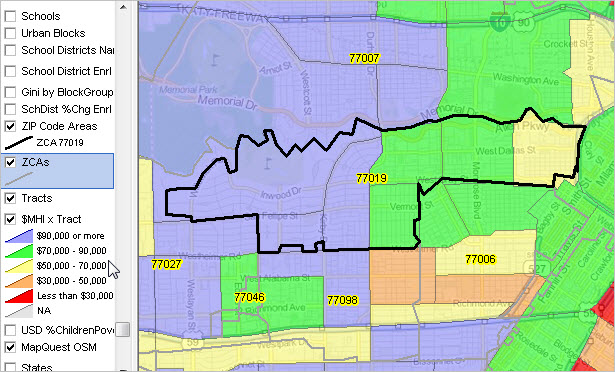
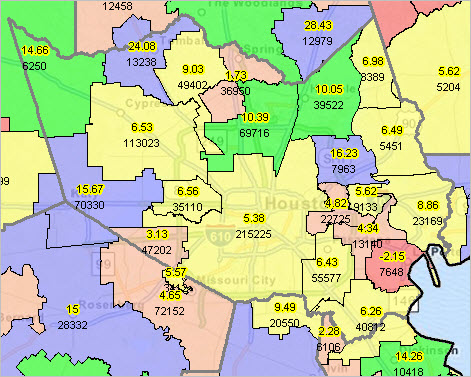
The following view uses the Fairfax County GIS project to examine voting districts (black boundaries) in context of neighborhood economic prosperity. The current vintage VTD shapefile (213 VTDs) was obtained from the County. This view shows median household income by census tract. Using the GIS layer editor, different types of demographic-economic subject matter (such as educational attainment, housing value, language spoken at home …) could be used.
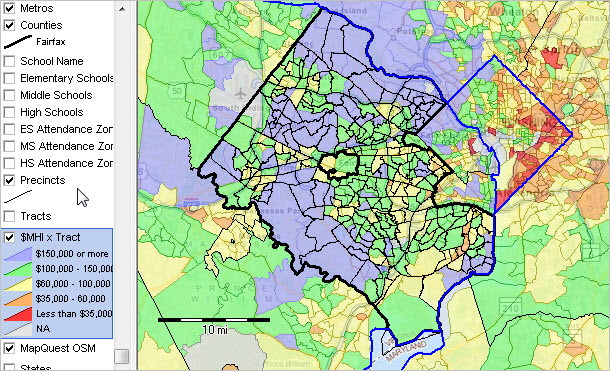
… Click graphic for larger view. View developed using CV XE GIS.
Voting District Scope and Vintages
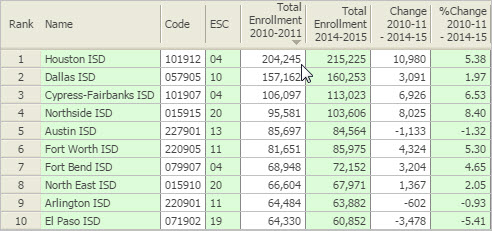
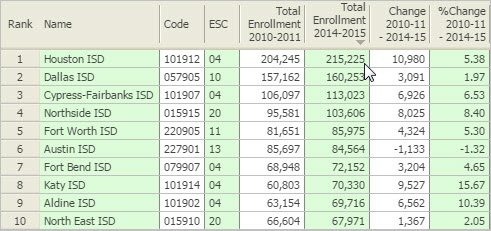
As of Census 2010, there were 177,808 VTDs covering the U.S. While shapefiles for Census 2010 vintage VTDs are available as a part of the TIGER geographic database, most of these areas have now been updated owing to redistricting and the 2012 and 2014 elections. VTD boundaries can change frequently. While Census 2010 demographic data were tabulated for Census 2010 VTDs, these demographics of less interest to analyzing post-redistricting scenarios due to the changing VTD geography.
Voting District Drill-down Demographics
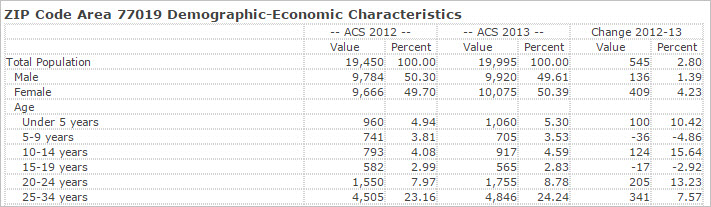
The following view uses the same Fairfax County GIS project to examine census block demographics by voting district. The graphic shows a zoom-in view focused on the Sherwood VTD in southeast Fairfax County. Using the CV XE GIS site analysis tool, all census blocks are selected within the Sherwood VTD (cross-hatched). A subset of blocks could have been selected to examine just part of the VTD. The table to the right of the map shows the aggregated total population and housing units for this VTD. As of Census 2010 there were 1,380 population in this VTD. Other demographic attributes, such as population by age, gender, or race/origin could be integrated into the shapefile using data sourced from Census 2010 Summary File 1.
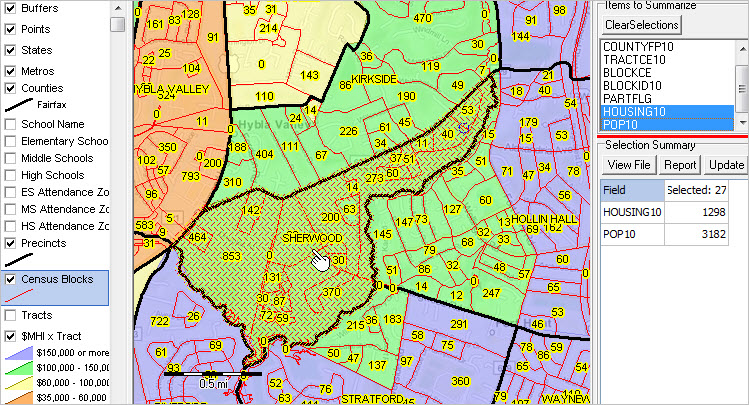
… Click graphic for larger view. View developed using CV XE GIS.
There are 27 census blocks that comprise the Sherwood VTD. Using the View File button in the above operation, these 27 census block records can be viewed using the CV XE GIS dBrowser tool. A partial view of the records is shown below. This file can be exported for use with other software.
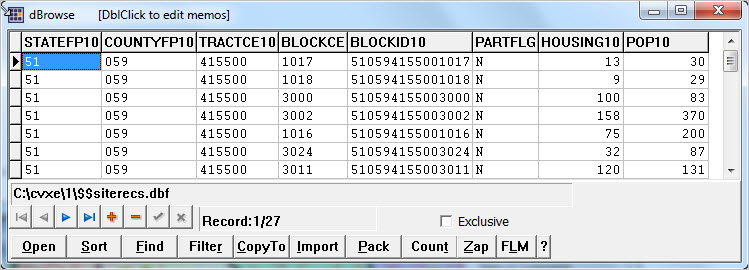
… Click graphic for larger view. View developed using CV XE GIS.
VTDs and Schools & School Attendance Zones
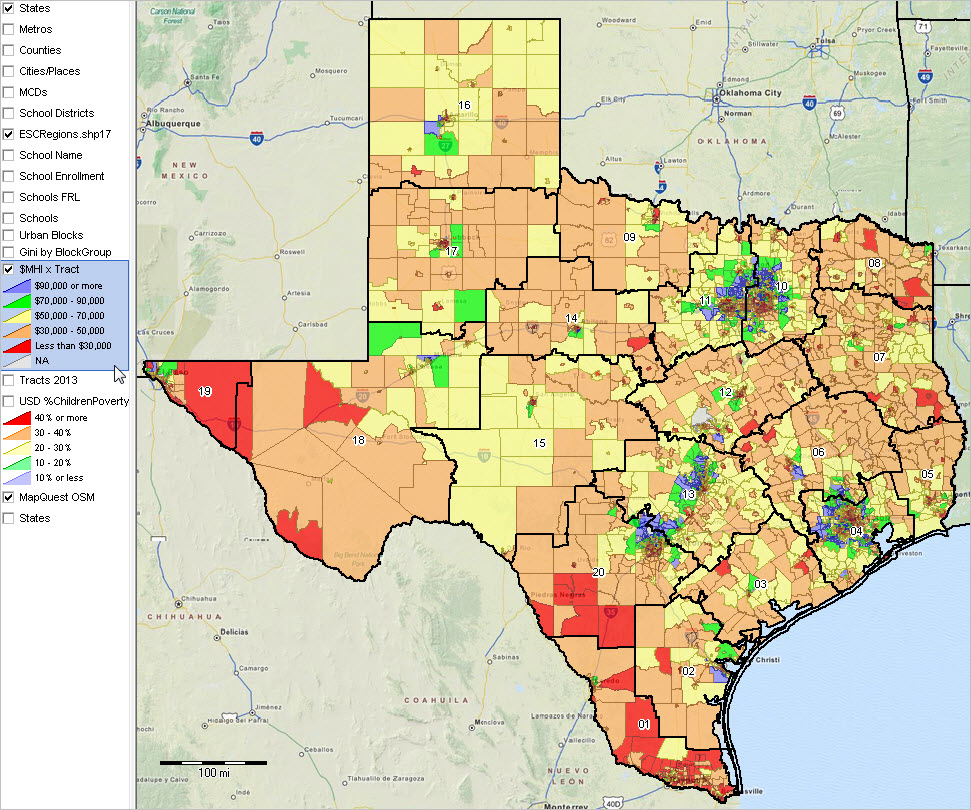
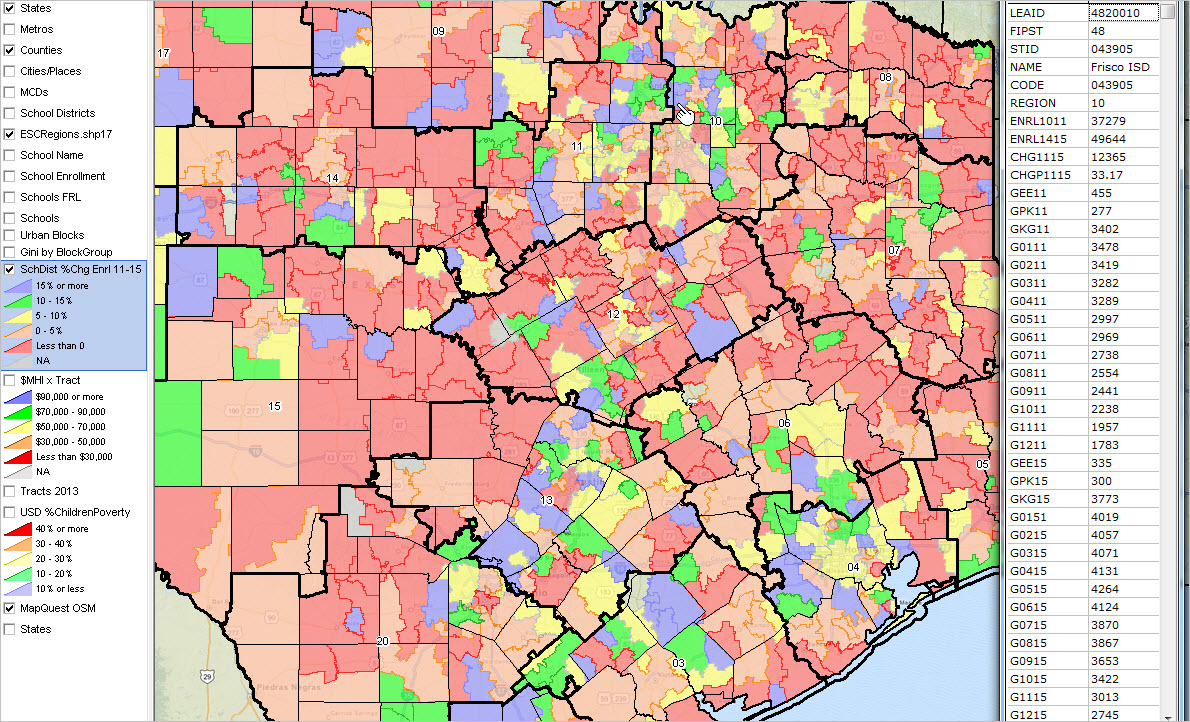
Using the GIS project, the attendance zone and schools layers can be checked/shown. School locations can be examined by VTD; VTDs intersecting attendance zones can be examined. What VTDs are relevant to which schools/attendance zones? What is the demographic composition of these VTDs? The following view shows high schools (red markers) and high school attendance zones (red boundaries). Note in the legend to the left of map view, that different types of schools and attendance zones can be viewed in wide-ranging combinations. Other types of geography can be added to the mix such as voting districts. The VTD/precincts layer is not shown in the following view so that the view of schools and attendance zones is not obstructed. It can be added to the view by clicking the checkbox by the Precincts layer in the legend panel to the left of the map view.
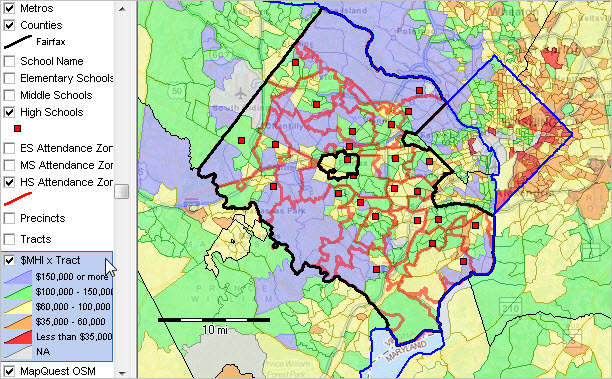
… Click graphic for larger view. View developed using CV XE GIS.
VTDs and One Person, One Vote
In May 2015, the Supreme Court agreed to consider redefining ‘one-person, one-vote’ principle. See USATODAY story. How might this ruling impact election precinct geography?
Issues to be examined in upcoming sections include determining the size of the voting age population by VTD and the size of the citizen voting age population. These attributes could be examined at the block group level of geography, not reviewed here. See additional information on the citizen voting age population.
About the Author
— Warren Glimpse is former senior Census Bureau statistician responsible for innovative data access and use operations. He is also the former associate director of the U.S. Office of Federal Statistical Policy and Standards for data access and use. He has more than 20 years of experience in the private sector developing data resources and tools for integration and analysis of geographic, demographic, economic and business data. Contact Warren. Join Warren on LinkedIn.