Category Archives: Neighborhoods

Examining Congressional Districts using VDA Desktop GIS via RDS

.. this section builds on the previous section “Using VDA Desktop GIS with Remote Desktop“. To recap, that section summarized how to make reference and geostatistical maps using the VDA Desktop GIS online via our Remote Desktop Service. Perform simple, easy-to-use mapping tasks, or more advanced geospatial analyses using VDA, Visual Data Analytics, GIS .. Geographic Information Systems. Here I review how to use any VDA GIS project with only Internet and most any device.

An Example using the California CD 06 (CD0646) GIS Project
1. Start VDA Desktop GIS using Remote Desktop Service .. see details.
2. When the RDS screen appears, click the VDAGIS icon, starting VDAD/RDS
.. this shows the default view, the “Base” GIS project.
3. Use File>Open to open the CD0646 GIS project
.. Next, the user could open any available GIS project.
.. Click File>Open then select file c:\cvxe\cd0646\cd0646.gis .. the project opens
.. Congressional District California 46
.. located in the Anaheim – Santa Ana area of Orange County, CA
4. Reviewing the Start-up View
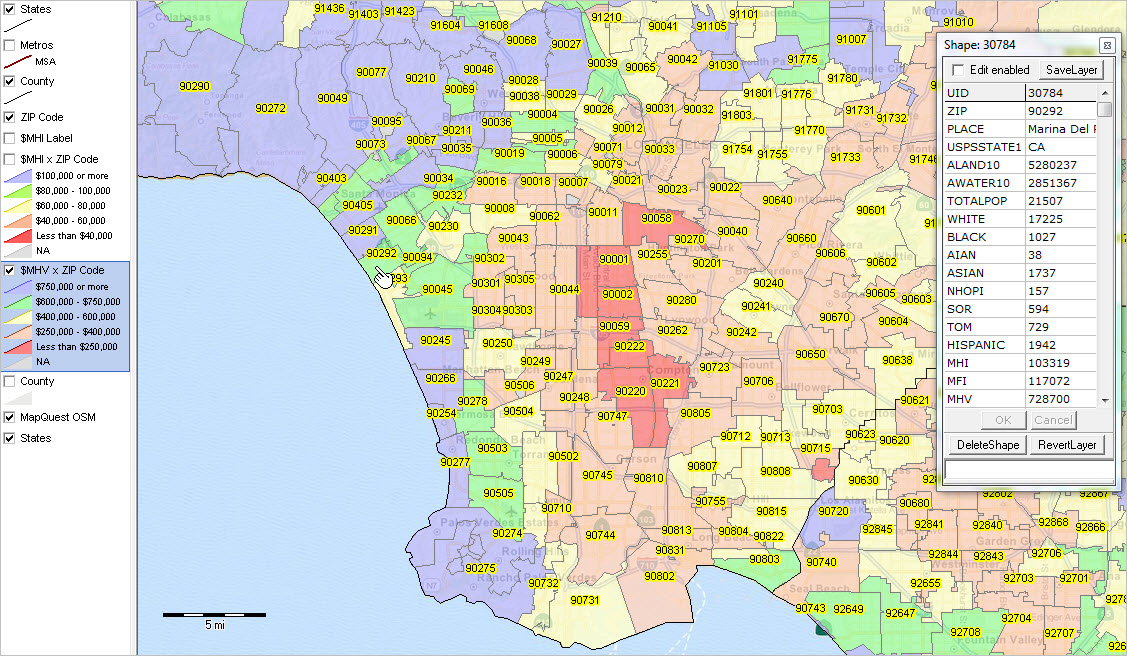
The following graphic shows, the project start-up view
.. California CD 46 (bold boundary) and Congressional Communities
.. examining economic prosperity (median household income) by census tract</a.

CA CD 46 with CCs; Patterns of Economic Prosperity .. click for larger view

Drill-down View of Santa Ana area by Ward .. click for larger view
This zoom-in view shows Santa Ana wards as with red boundaries in context of other geography reviewed above.

See Santa Ana ward boundaries using the official Santa Ana City website.

Citizen Voting Age Population by Block Group .. click for larger view
The following zoom-in view shows patterns of Citizen Voting Age Population (CVAP) by block group (BG) in the Santa Ana area in context of Congressional Community 0646005 (bold black boundary). Label shows total CVAP in that BG.

Drill-down View to Ward-CC-Block .. click for larger view
This zoom-in view shows one Santa Ana ward (red boundary) in context of census blocks (black boundaries) and related Congressional Community (gray bold boundary). Congressional Communities (CC) are geographic areas that nest within a Congressional District (CD), fully and exactly exhausting that CD area. CCs are comprised of a set of contiguous census blocks based on a range of criteria.

What’s Ahead
Updates on using VDA Desktop GIS will be included in forthcoming Blogs.
Don’t miss out! Click Follow in button at upper right.

About VDA GIS
Use VDA GIS tools to meet wide-ranging mapping needs and geospatial analysis. VDA Desktop GIS and VDA Web GIS have similar features that can be used separately or together. Each is a decision-making information resource designed to help stakeholders create and apply insight. VDA Web GIS is access/used with only a Web browser; nothing to install; GIS experience not required. VDA Desktop GIS is installed on a Windows computer and provides a broader range of capabilities compared to VDA Web GIS. VDA GIS resources have been developed and are maintained by Warren Glimpse, ProximityOne (Alexandria, VA) and Takashi Hamilton, Tsukasa Consulting (Osaka, Japan).

Data Analytics Web Sessions
Join us in the every Tuesday, Thursday Data Analytics Web Sessions. See how you can use VDA Web GIS and access different subject matter for related geography. Get your geographic, demographic, data access & use questions answered. Discuss applications with others.

About the Author
Warren Glimpse is former senior Census Bureau statistician responsible for national scope statistical programs and innovative data access and use operations. He is also the former associate director of the U.S. Office of Federal Statistical Policy and Standards for data access and use. He has more than 20 years of experience in the private sector developing data resources and tools for integration and analysis of geographic, demographic, economic and business data. Join Warren on LinkedIn.

School District Geography & GeoSpatial Analysis

.. the approximate 100,000 K-12 public schools, 13,000 school districts and 50 million school age children in the United States touch nearly every dimension of society and the economy. This section reviews the scope of school district geography as cachement areas for the K-12 public schools and school age population .. and tools to examine them in an integrated and holistic manner. How does school district instructional expenditure relate to the demographic-economic make-up of the district? Educational outcomes? How are leaders and educators equipped to make effective use of these tools and data?

School districts are geographic areas covering the U.S. to provide public K-12 education. I developed the first national scope school district boundary file in the mid-1990s, a joint project of the U.S. National Center for Education Statistics and the Census Bureau. School district boundaries are now updated annually as a part of the Census Bureau TIGER digital map database under the sponsorship of the U.S. National Center for Education Statistics (NCES). School district names, codes, enrollment by grade and many other attributes are updated annually as a part of the NCES Common Core of Data (CCD). The 2021-22 (latest data as of this time) school district CCD administrative data provides data for approximately 13,025 “regular” school districts. The CCD data are one type of data that can be merged (based on a common key of the NCES assigned local education ID) with TIGER-based school district shapefiles that can enable mapping and geospatial analysis. Using these shapefiles with Geographic Information System (GIS) software users can examine maps of districts by name, view boundaries or patterns such the per pupil instructional expenditure.

Types of School Districts
School districts, whose boundaries and operations are defined and managed by individual states, often exist as three types of school districts in differing combinations: elementary, secondary and unified. Some states have only unified school districts that are also the same as the counties (such as Florida, Kansas, Maryland and Nevada). California has perhaps the most complex array of mixed elementary, secondary and unified districts.

Huntington Beach, CA School Districts
The following view shows how 4 elementary districts (orange boundaries) each offering grades K-8 education collectively cover the same ground area as 1 secondary district, Huntington Beach Unified High School District (green bold boundary) offering grades 9-12 education.

K-12 School & School District GIS Project
The VDA GIS ready to use K-12 School & School District GIS project with CV XE GIS, VDA Desktop GIS or the VDA Web GIS to examine and geospatially analyze school districts and school district attributes in context of other geography and subject matter. For example, the following view shows patterns of neighborhood economic prosperity (median household income by census tract) for the Huntington Beach, CA school districts. Click graphic for larger view.

Viewing Your School District
To view your school district, follow these steps:
Start VDA Web GIS
Select the “K-12 Schools & School Districts” project.
When the map view opens
.. uncheck School District Elementary and School District Secondary
    in Legend Panel at left
Enter address in Search box above map (Apple Headquarters in this example)
Press enter and this view appears .. click blue triangle to view profile.
.. see that this district is Santa Clara Unified ..

About VDA GIS
There are two VDA GIS tools that have similar features that can be used separately or together. Each is a decision-making information resource designed to help stakeholders create and apply insight. VDA Web GIS is access/used with only a Web browser; nothing to install; GIS experience not required. VDA Desktop GIS is installed on a Windows computer and provides a broader range of capabilities compared to VDA Web GIS. VDA GIS resources have been developed and are maintained by Warren Glimpse, ProximityOne (Alexandria, VA) and Takashi Hamilton, Tsukasa Consulting (Osaka, Japan).

Data Analytics Web Sessions
Join us in the every Tuesday, Thursday Data Analytics Web Sessions. See how you can use VDA Web GIS and access different subject matter for related geography. Get your geographic, demographic, data access & use questions answered. Discuss applications with others.

About the Author
Warren Glimpse is former senior Census Bureau statistician responsible for national scope statistical programs and innovative data access and use operations. He is also the former associate director of the U.S. Office of Federal Statistical Policy and Standards for data access and use. He has more than 20 years of experience in the private sector developing data resources and tools for integration and analysis of geographic, demographic, economic and business data. Join Warren on LinkedIn.

Mapping Statistical Data

.. statistical mapping & visual data analysis … Geographic Information Systems (GIS) provide flexible and powerful capabilities to combine maps/geography with statistical data. In our increasingly data rich environment, we often experience “drowning in data.” GIS tools can help harness disparate and voluminous data and assist with data linkage. We are continuing to update the Mapping Statistical Data (MSD) program, providing access to ready-to-use, “production” GIS projects and datasets that you can use. This post reviews GIS tools that help enable this .. gaining insights by mapping and geospatial analysis of statistical data. Take a look at the recent addition .. census tracts experiencing persistent poverty. Follow this blog to learn about new, additional projects added to the MSD program.

The Virtual Data Analytics (VDA) Geographic Information System (about GIS) tools/resources operate on two platforms. The VDA Desktop GIS (VDAD) operates on a Windows computer. The VDA Web GIS (VDAW) operates on most devices, including Macs and phones, and is accessed/used with a browser. VDAD and VDAW can optionally use the same GIS project. Three examples of using the Congressional Communities GIS project using different VDA GIS tools are shown below. They look almost identical (the objective). Click graphic for larger view. See more about the Congressional Communities project.

VDA Desktop GIS – Opening a Local GIS Project
In this example, all files are stored locally.
The user interface is managed by VDA Desktop GIS program on the local computer.

VDA Desktop GIS – Opening a Web GIS Project
In this example, all files are stored on a VDA GIS server.
The user interface is managed by VDA Desktop GIS program on the local computer.

VDA Web GIS – Opening a Web GIS Project
In this example, all files are stored on a VDA GIS server.
The user interface is managed by VDA Web GIS on a VDA server.

About VDA GIS
There are two VDA GIS tools that have similar features that can be used separately or together. Each is a decision-making information resource designed to help stakeholders create and apply insight. VDA Web GIS is access/used with only a Web browser; nothing to install; GIS experience not required. VDA Desktop GIS is installed on a Windows computer and provides a broader range of capabilities compared to VDA Web GIS. VDA GIS resources have been developed and are maintained by Warren Glimpse, ProximityOne (Alexandria, VA) and Takashi Hamilton, Tsukasa Consulting (Osaka, Japan).

Data Analytics Web Sessions
Join us in the every Tuesday, Thursday Data Analytics Web Sessions. See how you can use VDA Web GIS and access different subject matter for related geography. Get your geographic, demographic, data access & use questions answered. Discuss applications with others.

About the Author
Warren Glimpse is former senior Census Bureau statistician responsible for national scope statistical programs and innovative data access and use operations. He is also the former associate director of the U.S. Office of Federal Statistical Policy and Standards for data access and use. He has more than 20 years of experience in the private sector developing data resources and tools for integration and analysis of geographic, demographic, economic and business data. Join Warren on LinkedIn.

Population Living Alone & Age 65 Years and Over

.. how many people are living alone in your community, neighborhood? How does this population impact the community? What are their special needs? How does this population vary by area and population group? There were 37.9 million one-person households, 29% of all U.S. households in 2022. In 1960, single-person households represented only 13% of all households. These estimates are based on the 2022 Current Population Survey (CPS). Moving forward, the number of one-person households, people living alone, will increase at the rate of one million or more per year. People in households exclude people living in group quarters. This post examines patterns of people living alone with focus on people living alone age 65 year and over and distribution by small area geography.

While the CPS data provide a current snapshot of the number of people living alone, we have to use data from the American Community Survey to obtain data for smaller area geography like counties and census tracts.

Population Living Alone by Census Tract –Visual Data Analytics
The four graphics below show patterns of the population living alone by census tract. These views have been developed using the Visual Data Analytics (VDA GIS) tools with integrated demographics. Develop variations on these views using the VDA Web GIS using only a web browser.

Patterns of Population Living Alone by Tract

.. click graphic for larger view.

Patterns of Population 65 and Over Living Alone by Tract

.. click graphic for larger view.

Patterns of Population Living Alone by Tract — Houston Metro Area

Patterns of Population 65 and Over Living Alone by Tract — Houston Metro Area

Examine the Data in More Detail
As noted in this related New York Times story, nearly 26 million Americans 50 or older now live alone, up from 15 million in 2000. Older people have always been more likely than others to live by themselves makes up a bigger share of the population than at any time in the nation’s history. The trend has also been driven by deep changes in attitudes surrounding gender and marriage. People 50-plus today are more likely than earlier generations to be divorced, separated or never married. Similar ACS data as used to develop the graphics shown above are available by race/origin. These data are based on the ACS 2020 data; the same scope of data will be available from ACS 2021 to be released in December 2022.

About VDA GIS
VDA Web GIS is a decision-making information resource designed to help stakeholders create and apply insight. Use VDA Web GIS with only a Web browser; nothing to install; GIS experience not required. VDA Web GIS has been developed and is maintained by Warren Glimpse, ProximityOne (Alexandria, VA) and Takashi Hamilton, Tsukasa Consulting (Osaka, Japan).

About the Author
Warren Glimpse is former senior Census Bureau statistician responsible for national scope statistical programs and innovative data access and use operations. He is also the former associate director of the U.S. Office of Federal Statistical Policy and Standards for data access and use. He has more than 20 years of experience in the private sector developing data resources and tools for integration and analysis of geographic, demographic, economic and business data. Join Warren on LinkedIn.

Housing Price Index by ZIP Code – How Housing Markets are Trending

.. housing prices can impact residential investment and affect economic growth, business opportunities and the housing market. The Housing Price Index (HPI) is one measure of how housing prices are changing. The HPI by ZIP code, as reviewed here, is an index based on the year 2000=100. Changing trends in the HPI can used used the determine the relative costs of housing and change in housing valuation. Hosing prices, and the HPI, are only one part of determining how housing markets are trending. Other measures important to examine include building permits and new construction.

Examining Housing Price Trends
Use the VDA Web GIS tool to examine the Housing Price Index for ZIP Codes of interest. Create maps and tabular profiles such as the one shown below.

Video of Steps to Explore HPI by ZIP Code
Click graphic to view video showing how to use VDA Web GIS to access a ZIP Code profile.

About VDA Web GIS
VDA Web GIS is a decision-making information resource designed to help stakeholders create and apply insight. VDA Web GIS has been developed and is maintained by Warren Glimpse, ProximityOne (Alexandria, VA) and Takashi Hamilton, Tsukasa Consulting (Osaka, Japan).

About the Housing Price Index
The Housing Price Index used here is developed by the Federal Housing Fiance Agency (FHFA). The FHFA House Price Index is the nation’s only public, freely available house price indexes that measure changes in single-family home values based on data from all states that extend back to the mid-1970s.

About the Author
Warren Glimpse is former senior Census Bureau statistician responsible for national scope statistical programs and innovative data access and use operations. He is also the former associate director of the U.S. Office of Federal Statistical Policy and Standards for data access and use. He has more than 20 years of experience in the private sector developing data resources and tools for integration and analysis of geographic, demographic, economic and business data. Join Warren on LinkedIn.

New Authorized Monthly Residential Construction by City 

.. access/analyze monthly building permits data for any/all of 7,700 cities in a few minutes via a web browser. Building permits data, a leading economic indicator, are one of the few current indicators available at the city level to examine characteristics and trends. These data can provide insights into the type and value of housing that is being added. Use the VDA Web GIS to examine how the housing situation is changing for cities of interest.

The VDA Web GIS MetroDynamics city layer/dataset is updated with the most recent 6 months of the number of housing units by type and value. The current data provide monthly aggregated data for January 2022 through June 2022. The layer/dataset includes many other attributes (see details). Of the ~19,000 U.S. cities, ~7,700 issue monthly building permits and accessible via this resource.

Examining City Housing Characteristics & Trends
An example: cities in the Phoenix, AZ area labeled with the total building permits.

.. table under map view shows cities with largest number of building permits.
.. see steps to develop the above map and table.

Illustrative Profile for Surprise, AZ
.. selected items from MetroDynamics City layer/dataset
.. integrated subject matter from several sources
.. building permits most current

About VDA Web GIS
VDA Web GIS is a decision-making information resource designed to help stakeholders create and apply insight. VDA Web GIS has been developed and is maintained by Warren Glimpse, ProximityOne (Alexandria, VA) and Takashi Hamilton, Tsukasa Consulting (Osaka, Japan).

About Building Permits Data
Building permits data are collected monthly by the Census Bureau from permit issuing agencies. Monthly data are reported for access within one month of the reporting date. Data are collected on the number of new housing units authorized by type of units in building by value.

About the Author
Warren Glimpse is former senior Census Bureau statistician responsible for national scope statistical programs and innovative data access and use operations. He is also the former associate director of the U.S. Office of Federal Statistical Policy and Standards for data access and use. He has more than 20 years of experience in the private sector developing data resources and tools for integration and analysis of geographic, demographic, economic and business data. Join Warren on LinkedIn.

Examine Neighborhood Demographics for any City

.. examine neighborhood demographics for any city (or county, school district ..) using the no fee, no registration new beta version of the Visual Data Analytics (VDA2) Web GIS. Nothing to install, access with any Web browser. Use this unique and powerful resource to make custom maps similar to the one shown below.

Patterns of Economic Prosperity by Neighborhood in Tampa, FL Area
Examine patterns of economic prosperity by neighborhood in context of a selected county, city or other geography. The following view shows patterns of median household income by census tract in Tampa, FL area. The bold black border shows the city boundary for Tampa; the thematic pattern shows colors associated with intervals of median household income ($MHI). The $MHI layer is set with a see through transparency enabling a view of the underlying topology. Create a view similar to this for any of the 19,500 cities in the U.S. See detailed steps to develop this view in the notes below the graphic.

Map Your Own Map View
Follow these stpe to create your own neighborhood by city map view.  Use other features of VDA2 to access demographic-economic data in a tabular or visual form.

More About VDA2 Web GIS
New in VDA2, not available in VDA1, are the table/query operations. View/analyze data for any layer in a spreadsheet/grid form.  Sort and perform queries on subject matter of interest. Click a button in the data grid to zoom to that geographic area in the map window.  The following graphic shows the VDA2 start-up view after clicking the Query/Table On/Off button. This button (shown below map window at right by pointer) toggles the table view on/off.

.. click graphic for larger view.

Learn more — Join me in the Situation & Outlook Web Sessions
Join me in a Situation & Outlook Web Session where we discuss topics relating to measuring and interpreting the where, what, when, how and how much demographic-economic change is occurring and it’s impact.

About the Author
— Warren Glimpse is former senior Census Bureau statistician responsible for national scope statistical programs and innovative data access and use operations. He is also the former associate director of the U.S. Office of Federal Statistical Policy and Standards for data access and use. He has more than 20 years of experience in the private sector developing data resources and tools for integration and analysis of geographic, demographic, economic and business data. Contact Warren. Join Warren on LinkedIn.

Tip of the Day – Examining Median Housing Value – 2020 Update

.. tip of the day .. a continuing weekly or more frequent tip on developing, integrating, accessing and using geographic, demographic, economic and statistical data. Join in .. tip of the day posts are added to the Data Analytics Blog on an irregular basis, normally weekly. Follow the blog to receive updates as they occur.

.. in this era of uncertainly, we ponder the risk and opportunity associated with changing housing value.  Median housing value by ZIP Code area is one metric of great interest to examine levels and change.  While only one measure useful to examine housing characteristics, it is part of a broader set of demographic-economic data that enable analysis of the housing infrastructure and change in a more wholistic manner. How is housing value trending at the neighborhood level in 2020 and beyond? See more about the Situation & Outlook.

.. 5 ways to access/analyze the most recent estimates of median housing value and other subject matter by ZIP Code area .. based on the American Community Survey (ACS) 5-year estimates. See related Web section.

Option 1. View the data as a thematic pattern map
Option 1 is presented as Option 1A (using CV XE GIS) and Option 1B (using Visual Data Analytics VDA Mapserver). See more about GIS.

Option 1A. View $MHV as a thematic pattern map; using CV XE GIS:
— Median Housing Value by ZIP Code Area; Los Angeles Area
Click graphic for larger view with more detail.

Click graphic for larger view.
Use the Mapping ZIP Code Demographics resources to develop similar views anywhere in U.S.

Option 1B. View $MHV (ACS 2018) as a thematic pattern map; using VDA Mapserver:
— Median Housing Value by ZIP Code Area; Phoenix/Scottsdale, AZ area
Click graphic for larger view with more detail.

Click graphic for larger view. Expand window to full screen for best quality view. View features:
– profile of ZIP 85258 (blue crosshatch highlight) shown in Attributes panel at left
– values-colors shown in Legend panel at left
– transparency setting allows “see through” to view ground topology below.
Use VDA Mapserver: to develop similar views anywhere in U.S. using only a browser. Nothing to install.

Option 2. Use the interactive table:
– go to http://proximityone.com/zip18dp4.htm (5-year estimates)
– median housing value is item H089; see item list above interactive table.
– scroll left on the table until H089 appears in the header column.
– that column shows the 2018 ACS H089 estimate for for all ZIP codes.
– click column header to sort; click again to sort other direction.
– see usage notes below table.

Option 3. Use the API operation:
– develop file containing $MHV for all ZIP code areas in U.S.
– load into Excel, other software; link with other data.
– median housing value ($MHV) is item B25077_001E.
click this link to get B25077_001E ($MHV) using the API tool.
– this API call retrieves U.S. national scope data.
– a new page displays showing a line/row for each ZIP code.
– median housing value appears on the left, then ZIP code.
– optionally save this file and import the data into a preferred program.
– more about API tools.
Extending option 3 … accessing race, origin and $MHV for each ZIP code …
click on these example APIs to access data for all ZIP codes
.. get extended subject matter for all ZIP codes
.. get extended subject matter for two selected ZIP codes (64112 and 65201)

Items used in these API calls:
.. B01003_001E – Total population
Age
.. B01001_011E — Male: 25 to 29 years (illustrating age cohort access)
.. B01001_035E — Female: 25 to 29 years (illustrating age cohort access)
Race/Origin
.. B02001_002E – White alone
.. B02001_003E – Black or African American alone
.. B02001_004E – American Indian and Alaska Native alone
.. B02001_005E – Asian alone
.. B02001_006E – Native Hawaiian and Other Pacific Islander alone
.. B02001_007E – Some other race alone
.. B02001_008E – Two or more races
.. B03001_003E – Hispanic (of any race)
Income
.. B19013_001E – Median household income ($)
.. B19113_001E – Median family income ($)
Housing & Households
.. B25001_001E – Total housing units
.. B25002_002E – Occupied housing units (households)
.. B19001_017E — Households with household income $200,000 or more
.. B25003_002E — Owner Occupied housing units
.. B25075_023E — Housing units value $500,000 to $749,999
.. B25075_024E — Housing units with value $750,000 to $999,999
.. B25075_025E — Housing units with value $1,000,000 or more
.. B25002_003E – Vacant housing units
.. B25077_001E – Median housing value ($) – owner occupied units
.. B25064_001E – Median gross rent ($) – renter occupied units

View additional subject matter options.

Option 4. View the $MHV in context of other attributes for a ZIP code.
Using – ACS demographic-economic profiles. Example for ZIP 85258:
General Demographics ACS 2018 .. ACS 2017
Social Characteristics ACS 2018 .. ACS 2017
Economic Characteristics ACS 2018 .. ACS 2017
Housing Characteristics ACS 2018 .. ACS 2017 .. $MHV shown in this profile.

Option 5. View 5- and 10-mile circular area profile from ZIP center.
– profile for ZIP 80204 dynamically made using SiteReport tool.
– with SiteReport running, enter the ZIP code, radii and click Run.
– comparative analysis report is generated in HTML and Excel structure.
Click this link to view resulting profile.
– from the profile, site 2 is 1.9 times the population of site 1.
– Site 1 $MHV is $296,998 compared to Site 2 $MHV $269,734.
– GIS view with integrated radius shown below.

This section is focused on median housing value and ZIP code areas. Many other subject matter items will be apparent when these methods are used. Optionally adjust above details to view different subject matter for ZIP codes.

Join me in a Data Analytics Lab session to discuss more details about accessing and using wide-ranging demographic-economic data and data analytics. Learn more about using these data for areas and applications of interest.

About the Author
— Warren Glimpse is former senior Census Bureau statistician responsible for innovative data access and use operations. He is also the former associate director of the U.S. Office of Federal Statistical Policy and Standards for data access and use. He has more than 20 years of experience in the private sector developing data resources and tools for integration and analysis of geographic, demographic, economic and business data. Contact Warren. Join Warren on LinkedIn.

Analyzing Block Group Demographics

.. tools & data to analyze sub-census tract households, education, income, housing, more … Block Groups, subdivisions of census tracts, are the smallest geographic areas for which “richer demographics” are developed by the Census Bureau. Block group demographic-economic estimates, based on Census 2010 geography, are annually updated beginning with American Community Survey (ACS) 2010. The latest ACS estimates for these 217,740 areas covering U.S. wall-to-wall are from ACS 2015. The ACS 2016 update will be released in December 2017.  See the related Web section for more detail about accessing and using block group geography and demographic-economic data.

Patterns of Economic Prosperity by Block Group
The following graphic shows patterns of median household income by block group in the Houston, TX area. Markers show block groups with 10 or more housing units having value of $2 million or more. Markers are labeled with the number of housing units having value of $2 million or more in that block group. Click graphic for larger view, more detail and legend color/data intervals. This map illustrates the geographic level of detail available using block group demographics and the relative ease to gain insights using geospatial data analytics tools.

– View developed using CV XE GIS and related GIS project.

Block Group Demographic-Economic Data & Shapefiles
… selection of key demographic-economic attributes; annual update
… subject matter categories include:
  • Total population>
  • Population by gender iterated by age
  • Population by race/origin
  • Households by type of household
  • Educational attainment by detailed category
  • Household Income by detailed category
  • Housing units by owner/renter occupancy
  • Housing units by units in structure
  • Housing units by detailed value intervals

See the related Web section for a detailed list of items.

Use these Data on Your Computer
Use the above U.S. national scope dataset with your own software or in ready-to-use GIS projects with the CV XE GIS software.

Join me in a Data Analytics Lab session to discuss more details about accessing and using wide-ranging demographic-economic data and data analytics. Learn more about using these data for areas and applications of interest.

About the Author
— Warren Glimpse is former senior Census Bureau statistician responsible for innovative data access and use operations. He is also the former associate director of the U.S. Office of Federal Statistical Policy and Standards for data access and use. He has more than 20 years of experience in the private sector developing data resources and tools for integration and analysis of geographic, demographic, economic and business data. Contact Warren. Join Warren on LinkedIn.

Relating ZIP Codes to City/Places

.. relating ZIP codes to cities .. 214 ZIP code areas intersect with New York city — what are these ZIP codes, their population and how many are completely within the city? What part of a ZIP code area of interest intersects with what city? Conversely, what ZIP code areas intersect with a city of interest? This section provides data and tools that can be used to answer these types of questions and gain insights into geospatial relationships. See more detailed information in the related full Web section.

The 2010 ZIP Code Tabulation Area (ZCTA) to City/Place relationship data provide a means to equivalence ZCTAs with Census 2010 cities/places. ZCTAs are geographic areas defined as sets of Census 2010 census blocks closely resembling USPS ZIP codes (lines, not areas). ZCTA boundaries are fixed for the intercensal period 2010 through 2020. Census 2010 vintage city/place areas are likewise defined as sets of Census 2010 census blocks. The ZCTA-City/place relationship data are developed through the use of the intersecting census block geography and associated Census 2010 Summary File 1 demographic data.

ZCTA-Place Relationships
The following graphic shows relationships between two selected ZCTAs (red boundaries) and related cities/places (blue fill pattern) in the Pima/Cochise County, AZ area. Relationships between these geographies are reviewed in examples shown below.

– View developed using CV XE GIS and related GIS project.

Using the ZCTA-Place Relationship Data
Two examples illustrating how to use the ZCTA-place relationship data are provided below. The examples are interconnected to the GIS project used to develop the map views, interactive table and data file described in this section. Example 1 describes how to use the data for a ZIP code area entirely located within one city/place. Example 2 describes how to use the data for a ZIP code area located in more than one city/place and area not located in any city/place.

ZCTA to Place Relationships: Example 1
In this example, ZCTA 85711, highlighted in red in the graphic shown below, falls wholly within place 77000, outlined in bold black below. As a result, there is only one corresponding record for ZCTA 85711 in the relationship file. The 2010 Census population for this relationship record is 41,251 (POPPT) which is equal to the 2010 Census population for ZCTA 85711 (ZPOP). See more details about this example.

ZCTA to Place Relationships: Example 2
In this example, ZCTA 85630, highlighted below in red in the graphic shown below, contains two places: all of place 62280 and part of place 05770, both are outlined in black below. As a result, there are two corresponding relationship records in the relationship file. For the first relationship record, the total 2010 Census population for ZCTA is 2,819 (ZPOP). See more details about this example.

Using the Interactive Table
Use the full interactive table to examine U.S. national scope ZCTA-city/place relationships. The following graphic illustrates how ZIP code can be displayed/examined for one city — Tucson, AZ. Each row summarizes characteristics of a ZIP code in Tucson. The last row in the graphic shows characteristics of ZIP code 85711 — the same ZIP code reviewed in Example 1 above.

Click graphic for larger view.

Join me in a Data Analytics Lab session to discuss more details about accessing and using wide-ranging demographic-economic data and data analytics. Learn more about using these data for areas and applications of interest.

About the Author
— Warren Glimpse is former senior Census Bureau statistician responsible for innovative data access and use operations. He is also the former associate director of the U.S. Office of Federal Statistical Policy and Standards for data access and use. He has more than 20 years of experience in the private sector developing data resources and tools for integration and analysis of geographic, demographic, economic and business data. Contact Warren. Join Warren on LinkedIn.