Tag Archives: metropolitan areas

Combined Statistical Area Demographic Trends

.. a Combined Statistical Area (CSA) is a group of two or more adjacent metropolitan areas; they include contiguous metro counties that have demographic-economic affinity. These 172 areas (September 2018 vintage) are important in wide-ranging geographic and demographic analysis. Based on the 2018 population estimate, these areas include 256.2 million population of the total U.S. population of 327.2 million (78.3 percent). CSAs are at least two adjacent metropolitan areas — reflecting a larger and broader market/service/impact assessment area. Due to their size (of many), it is often possible to develop more detailed custom demographic-economic estimates and projections than at the county or metropolitan area level. See more about CSAs in this related Web section.

Patterns of 2018 Population by 2018 CSA
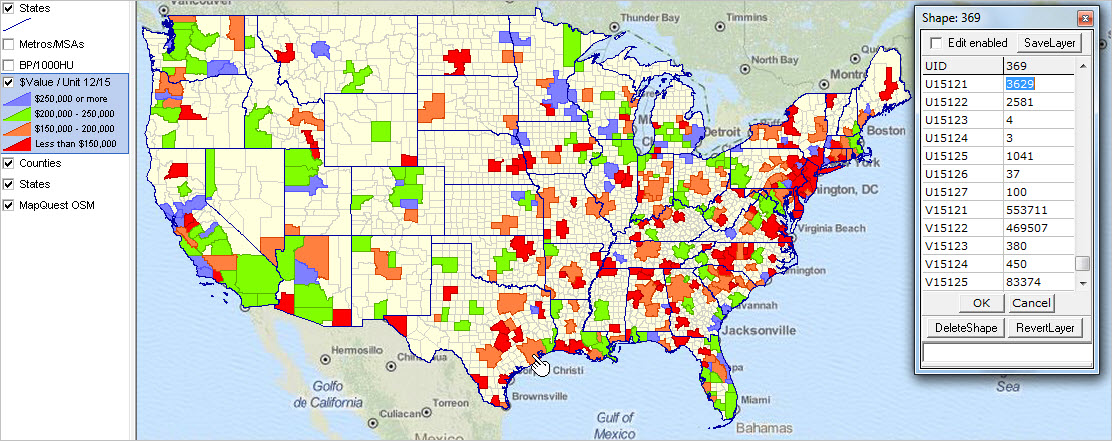
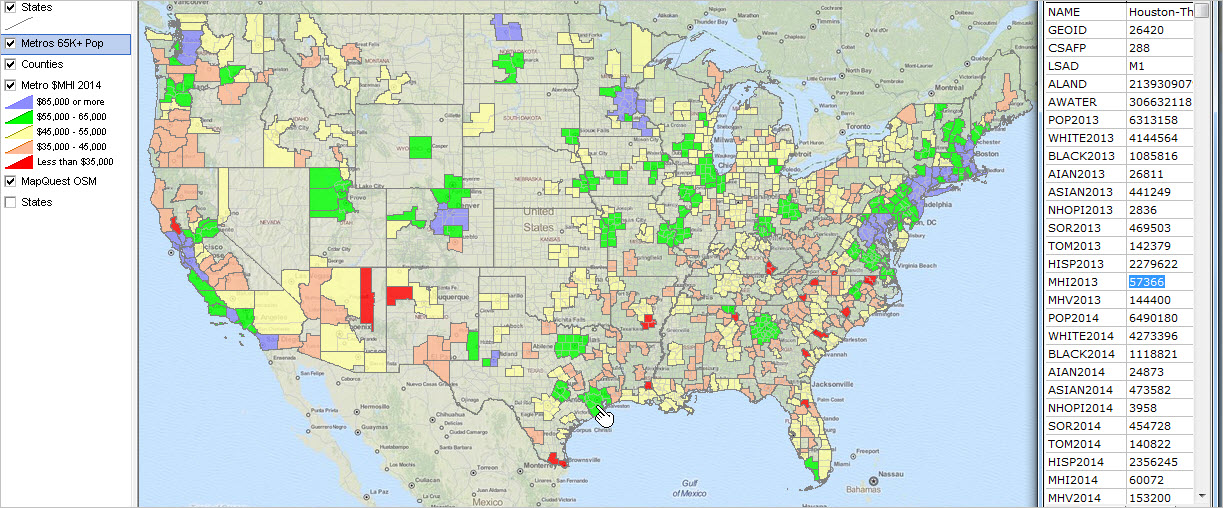
The following graphic shows the September 2018 vintage CSAs based on the 2018 official population estimates. The intervals/colors are depicted in legend panel at left of map window. Create custom maps similar to this view for your regions of interest. Use the GIS project/datasets to examine alternative patterns such as percent change for different time periods. Set queries to include CSAs by peer group. Click graphic for larger view with more detail; expand browser window for best quality view. Larger view shows CSAs labeled with percent population chnage 2010-2018.

– view developed with CV XE GIS software and related GIS project.

Use the GISproject and datasets to examine CSAs in a mapping and geospatial analysis context. The database includes all CSAs and the subject matter described below.

Using the Interactive Table
Use the interactive table (opens new page) to examine patterns and relationships among CSAs of interest. The following static graphic illustrates how the table can be used to rank or query CSAs and display selected columns. Selecting population change columns and ranking in descending order on population change 2010-2018, shows that the Dallas CSA had the largest population … it also shows this CSA was the 7th largest CSA based on 2018 population and 9th on percent population change 2010-2018 … use the table to determine which CSA ranked first on percent population change 2010-2018.

– click graphic for larger view.

Data Analytics Web Sessions
See these applications live/demoed. Run the applications on your own computer.
Join me in a Data Analytics Lab session to discuss more details about accessing and using wide-ranging demographic-economic data and data analytics. Learn more about using these data for areas and applications of interest.

About the Author
— Warren Glimpse is former senior Census Bureau statistician responsible for innovative data access and use operations. He is also the former associate director of the U.S. Office of Federal Statistical Policy and Standards for data access and use. He has more than 20 years of experience in the private sector developing data resources and tools for integration and analysis of geographic, demographic, economic and business data. Contact Warren. Join Warren on LinkedIn.

Visualizing Metro Area Geography

.. metropolitan areas are referred to as CBSAs (Core-Based Statistical Areas) and formally defined as sets of contiguous counties for the Federal Statistical System by OMB based largely on Census Bureau data.  More than 93-percent of the U.S. population live in CBSAs. This post presents three map graphics showing the geographic configuration of CBSAs and related CSAs (Combined Statistical Areas) — groupings of contiguous CBSAs that meet certain criteria. See related Web section for more detail.

The graphics below use the September 2018 CBSA vintage, the current and likely to be used for Census 2020 tabulations. These CBSAs are comprised of 392 Metropolitan Statistical Areas (MSAs), 384 MSAs in the U.S. and 8 in Puerto Rico, and 546 Micropolitan Statistical Areas (MISAs), 542 in the U.S. and 4 in Puerto Rico. For those MSAs that qualify, 11 MSAs are subdivided into 31 Metropolitan Divisions (MDs).

Metro Demographic-Economic Insights. What are the demographic characteristics of metros, how are they changing? We have developed annual population and population components of change estimates for the September 2018 vintage CBSAs.  Access these data in this interactive table. View CBSA county components. These data are integrated with other data to develop wide-ranging demographic-economic current estimates and projections for CBSAs and other geography (Situation & Outlook).

Metropolitan Statistical Areas, Sep 2018 Vintage
The following graphic shows the 2018 vintage Metropolitan Statistical Areas (MSAs). Use the associated GIS project to examine different years or subject matter items. Click graphic for larger view showing combined MSAs and MISAs.
Expand browser window for best quality view.


.. view developed with ProximityOne CV XE GIS and related GIS project.
.. create other views, geospatially analyze your data with associated GIS project.

Micropolitan Statistical Areas, Sep 2018 Vintage
The following graphic shows the 2018 vintage Micropolitan Statistical Areas (MISAs). Use the associated GIS project to examine different years or subject matter items. Click graphic for larger view showing combined MSAs and MISAs. Expand browser window for best quality view.


.. view developed with ProximityOne CV XE GIS and related GIS project.
.. create other views, geospatially analyze your data with associated GIS project.

Combined Statistical Areas, Sep 2018 Vintage
The following graphic shows the 2018 vintage Combined Statistical Areas (CSAs).
CSAs are contiguous CBSAs that are combined to form a CSA when certain conditions are met. Use the associated GIS project to examine different years or subject matter items. Click graphic for larger view showing CSAs with county overlay (visually determining which counties are in a CSA). Expand browser window for best quality view.


.. view developed with ProximityOne CV XE GIS and related GIS project.
.. create other views, geospatially analyze your data with associated GIS project.

DemographicEconomic Analytics Web Sessions
Join me in a Demographics Analytics Lab session to discuss more details about accessing and using wide-ranging demographic-economic data and data analytics. Learn more about using these data for areas and applications of interest.

About the Author
— Warren Glimpse is former senior Census Bureau statistician responsible for innovative data access and use operations. He is also the former associate director of the U.S. Office of Federal Statistical Policy and Standards for data access and use. He has more than 20 years of experience in the private sector developing data resources and tools for integration and analysis of geographic, demographic, economic and business data. Contact Warren. Join Warren on LinkedIn.

New Monthly Residential Construction by Metro Updates

.. tools, data & methods to assess the housing situation, examine housing supply and demand market conditions, and how metros of interest are changing.  New July 2016 building permits (new housing units authorized) and over-the year monthly data are now available for each metropolitan statistical area (MSA).

Use the interactive table to view, query, rank, compare data by metro. Map and geospatially analyze construction patterns with the CV XE GIS software and ready-to-use GIS project/datasets – see details.

Updated Resources to Examine Residential Construction Patterns
Metro Situation & Outlook Reports
.. metro by metro … examples: Houston, Los Angeles, Chicago, Atlanta.
County Annual U.S. by county
County & City/Place Monthly

Patterns of New Authorized Residential Units by Metropolitan Area
The following graphic shows value of single unit structures units authorized  by metro. Larger view shows more details including a mini-profile of housing units authorized detail. Create similar views for preferred time periods and different residential unit attributes using the GIS project.  Zoom-in to areas of interest.  Label the geography as desired.  Add your own data.

View created with CV XE GIS. Click graphic for larger view.

The time lag from reference date to access date of these data is one month, contributing to both the freshness of the data and importance of the data as a leading economic indicator. The importance of these data transcends issues concerning housing market conditions alone.  These data are one part of a mix of demographic-economic factors required to understand housing market conditions and the local/regional economy. These data are a part of the process to develop the ProximityOne county and sub-county demographic-economic estimates and projections.

Join me in a Data Analytics Lab session to discuss more details about accessing and using wide-ranging demographic-economic data and data analytics. Learn more about using these data for areas and applications of interest.

About the Author
— Warren Glimpse is former senior Census Bureau statistician responsible for innovative data access and use operations. He is also the former associate director of the U.S. Office of Federal Statistical Policy and Standards for data access and use. He has more than 20 years of experience in the private sector developing data resources and tools for integration and analysis of geographic, demographic, economic and business data. Contact Warren. Join Warren on LinkedIn.

State and Regional Decision-Making Information

Organized on a state-by-state basis, use tools and geographic, demographic and economic data resources in these sections to facilitate planning and analysis. Updated frequently, these sections provide a unique means to access to multi-sourced data to develop insights into patterns, characteristics and trends on wide-ranging issues. Bookmark the related main Web page; keep up-to-date.

Using these Resources
Knowing “where we are” and “how things have changed” are key factors in knowing about the where, when and how of future change — and how that change might impact you. There are many sources of this knowledge. Often the required data do not knit together in an ideal manner. Key data are available for different types of geography, become available at different points in time and are often not the perfect subject matter. These sections provide access to relevant data and a means to consume the data more effectively than might otherwise be possible. Use these data, tools and resources in combination with other data to perform wide-ranging data analytics. See examples.

Select a State/Area

Alabama
Alaska
Arizona
Arkansas
California
Colorado
Connecticut
Delaware
D.C.
Florida
Georgia
Hawaii
Idaho
Illinois
Indiana
Iowa
Kansas
Kentucky
Louisiana
Maine
Maryland
Massachusetts
Michigan
Minnesota
Mississippi
Missouri
Montana
Nebraska
Nevada
New Hampshire
New Jersey
New Mexico
New York
North Carolina
North Dakota
Ohio
Oklahoma
Oregon
Pennsylvania
Rhode Island
South Carolina
South Dakota
Tennessee
Texas
Utah
Vermont
Virginia
Washington
West Virginia
Wisconsin
Wyoming

Topics for each State — with drill-down to census block
Visual pattern analysis tools … using GIS resources
Digital Map Database
Situation & Outlook
Metropolitan Areas
Congressional Districts
Counties
Cities/Places
Census Tracts
ZIP Code Areas
K-12 Education, Schools & School Districts
Block Groups
Census Blocks

Join me in a Data Analytics Lab session to discuss more details about accessing and using wide-ranging demographic-economic data and data analytics. Learn more about using these data for areas and applications of interest.

About the Author
— Warren Glimpse is former senior Census Bureau statistician responsible for innovative data access and use operations. He is also the former associate director of the U.S. Office of Federal Statistical Policy and Standards for data access and use. He has more than 20 years of experience in the private sector developing data resources and tools for integration and analysis of geographic, demographic, economic and business data. Contact Warren. Join Warren on LinkedIn.

Dallas, TX Metro Situation & Outlook

… examining characteristics, patterns and change for the Dallas-Fort Worth-Arlington, TX metropolitan area … the total population of the metro changed from 6,452,725 in 2010 to 6,954,330 in 2014, a change of 501,605 (7.77%). Among all 917 metros, this metro was ranked number 4 in 2010 and 4 in 2014, based on total population …
• How will the market for single family homes change over the next 5 years?
• How does economic prosperity in this metro compare to others?
• What are the patterns in metro rental income and rental vacancy rates?
• How do patterns vary within the metro by county/neighborhood?
• How are demographic-economic characteristics trending?

We examine these types of topics in this section. Stakeholders can replicate applications reviewed here for this and other metros. Select any metro.

.. this section now continuously updated … see Dallas Metro Situation & Outlook; see related Texas Demographic-Economic Characteristics.

Metropolitan areas include approximately 94 percent of the U.S. population — 85 percent in metropolitan statistical areas (MSAs) and 9 percent in micropolitan statistical areas (MISAs). Of 3,143 counties in the United States, 1,167 are in the 381 MSAs in the U.S. and 641 counties are in the 536 MISAs (1,335 counties are in non-metro areas).

Focus on Dallas-Fort Worth-Arlington, TX MSA
This section is focused on the Dallas-Fort Worth-Arlington, TX MSA; Core-Based Statistical Area (CBSA) 19100. It is not intended to be a study of the metro but rather review recent and trending decision-making data that can be brought together to examine patterns and change and develop insights. The data, tools and methods can be applied to any metro.
– See a more detailed version of this document focused on this metro.

The Dallas-Fort Worth-Arlington, TX MSA is shown in the graphic below. The 7-county metropolitan statistical area is shown with bold boundary; counties appear with black boundaries and county name/geographic code labels.

Click graphic for larger view and details. Map developed using CV XE GIS.

Patterns of Economic Prosperity by Neighborhood
Median household income by census tract

Click graphic for larger view and map legend. Map developed using CV XE GIS.

Develop variations of this map view using the Mapping Texas Neighborhood Patterns GIS resources.

Fortune 1000 Companies
This metro is home to 40 Fortune 1000 companies including AT&T, American Airlines, Comerica, Dean Foods, Exxon Mobil, Fluor Corporation, J.C. Penney, Kimberly-Clark, Lennox International, Michaels Stores, Neiman Marcus, RadioShack, Southwest Airlines, Tenet Healthcare and many others.

Principal Cities
Metro principal cities (about principal cities) … click the link to view city profile   Arlington .. Dallas .. Denton .. Fort Worth .. Irving .. Plano .. Richardson

Overview of Selected Demographic-Economic Characteristics
The total population of the Dallas-Fort Worth-Arlington, TX metro changed from 6,452,725 in 2010 to 6,954,330 in 2014, a change of 501,605 (7.77%). Among all 917 metros, this metro was ranked number 4 in 2010 and 4 in 2014, based on total population. Annual net migration was 62,320 (2011), 77,089 (2012), 57,645 (2013), 74,176 (2014). View annual population estimates and components of change table.

This metro is projected to have a total population in 2020 of 7,418,541. The projected population change from 2010 to 2020 is 965,816 (15.0%). The population ages 65 years and over is projected to change from 592,695 (2010) to 1,031,937 (2020), a change of 439,242 (74.1%). See more about population projections.

Based on per capita personal income (PCPI), this metro was ranked number 61 in 2008 and 76 in 2014. among the 917 metros for which personal income was estimated.The PCPI changed from $44,697 in 2008 to $49,506 in 2014, a change of $4,809 (10.8%). Per capita personal income (PCPI) is a comprehensive measure of individual economic well-being. Use the interactive table to compare PCPI in this metro to other metros.

282 metropolitan statistical areas, of the total 381, experienced an increase in real Gross Domestic Product (GDP) between 2009 and 2014. This metro ranked number 5 among the 381 metros based on 2014 GDP. The GDP (millions of current dollars) changed from $355,756 in 2009 to $504,358 in 2014 a change of $148,602 (41.77%). Real GDP (millions of real, inflation adjusted, dollars) changed from $355,756 in 2009 to $460,154 in 2014, a change of $104,398 (29.35%). GDP is the most comprehensive measure of metro economic activity. GDP is the sum of the GDP originating in all industries in the metro.

View additional selected details about the metro …
Population Characteristics & Trends
–  Component City Characteristics
–  Component County Characteristics
– General Demographic Characteristics
Housing Characteristics & Trends
Total Housing Units
General Housing Characteristics
Residential Construction; Housing Units Authorized & Value
Housing Price Index
Economic Characteristics & Trends
Economic Profile
– Gross Domestic Product
Establishments, Employment & Earnings by Type of Business
Labor Market Characteristics & Trends
Education Infrastructure
Component School District Characteristics
Component Higher Education Institution Characteristics

Weekly Data Analytics Lab Sessions
Join me in a Data Analytics Lab session to discuss more details about this metro, comparing this metro to peer group metros and use of data analytics to develop further detail related to your situation.

About the Author
— Warren Glimpse is former senior Census Bureau statistician responsible for innovative data access and use operations. He is also the former associate director of the U.S. Office of Federal Statistical Policy and Standards for data access and use. He has more than 20 years of experience in the private sector developing data resources and tools for integration and analysis of geographic, demographic, economic and business data. Contact Warren. Join Warren on LinkedIn.

Metros 2015: Minneapolis-St. Paul-Bloomington, MN-WI

… examining Minneapolis-St. Paul-Bloomington, MN-WI metropolitan area:
• How will the market for single family homes change over the next 5 years?
• How does economic prosperity in this metro compare to others?
• What are the patterns in metro rental income and rental vacancy rates?
• How do patterns vary within the metro by county/neighborhood?
• How are demographic-economic characteristics trending?

We examine these types of topics in this section. Stakeholders can replicate applications reviewed here for this and other metros. Select any metro.

Metropolitan areas include approximately 94 percent of the U.S. population — 85 percent in metropolitan statistical areas (MSAs) and 9 percent in micropolitan statistical areas (MISAs). Of 3,143 counties in the United States, 1,167 are in the 381 MSAs in the U.S. and 641 counties are in the 536 MISAs (1,335 counties are in non-metro areas).

Focus on Minneapolis-St. Paul-Bloomington, MN-WI MSA
This section is focused on the Minneapolis-St. Paul-Bloomington, MN-WI MSA; Core-Based Statistical Area (CBSA) 33460. It is not intended to be a study of the metro but rather illustrate how relevant decision-making information resources can be brought together to examine patterns and change and develop insights. The data, tools and methods can be applied to any metro.
– See a more detailed version of this document focused on this metro.

The Minneapolis-St. Paul-Bloomington, MN-WI MSA is shown in the graphic below. The 20-county metropolitan statistical area is shown with bold boundary; counties appear with black boundaries and county name/geographic code labels.

Click graphic for larger view. Map developed using CV XE GIS.

This metro is home to Fortune 1000 companies including 3M Company, Ameriprise Financial, Best Buy Co., General Mills, Inc., Land O’Lakes, Inc. and many others.

Metro principal cities (about principal cities) … click the link to view city profile   Bloomington .. Eagan ..  Eden Prairie .. Minneapolis .. Plymouth ..  St. Paul

The total population of the Minneapolis-St. Paul-Bloomington, MN-WI metro changed from 3,355,105 in 2010 to 3,495,176 in 2014, a change of 140,071 (4.17%). Among all 917 metros, this metro was ranked number 16 in 2010 and 16 in 2014, based on total population. Annual net migration was 10,659 (2011), 10,100 (2012), 13,897 (2013), 10,762 (2014). View annual population estimates and components of change table. See more about population characteristics below.

This metro is projected to have a total population in 2020 of 3,698,877. The projected population change from 2010 to 2020 is 343,772 (10.2%). The population ages 65 years and over is projected to change from 372,335 (2010) to 603,936 (2020), a change of 231,601 (62.2%). See more about population projections.

Based on per capita personal income (PCPI), this metro was ranked number 37 in 2008 and 44 in 2014. The PCPI changed from $47,956 in 2008 to $53,166 in 2014, a change of $5,210 (10.9%). Per capita personal income (PCPI) is a comprehensive measure of individual economic well-being. Use the interactive table to compare PCPI in this metro to other metros.

The following thematic pattern shows a measure of economic prosperity (median household income: MHI) by census tract.

Click graphic for larger view. Map developed using CV XE GIS.
Develop variations of this map view using the Mapping Minnesota Neighborhood Patterns GIS resources.

View additional selected details about the metro …
–  Component City Characteristics
–  Component County Characteristics
–  Economic Profile
–  Component School District Characteristics

Join me in a Data Analytics Lab session to discuss more details about this metro, comparing this metro to peer group metros and use of data analytics to develop further detail related to your situation.

About the Author
— Warren Glimpse is former senior Census Bureau statistician responsible for innovative data access and use operations. He is also the former associate director of the U.S. Office of Federal Statistical Policy and Standards for data access and use. He has more than 20 years of experience in the private sector developing data resources and tools for integration and analysis of geographic, demographic, economic and business data. Contact Warren. Join Warren on LinkedIn.

Metropolitan Areas & Fortune 1000 Companies

.. examining Fortune 1000 companies by metro .. the mix of small and large businesses can be important to the dynamic and opportunities for any area. Larger businesses often provide a hub for the evolvement and expansion of small businesses – an important ingredient to employment growth and economic progress. Visit the related Web section for more details.

Not surprising, the New York metro leads the way with headquarters to 115 Fortune 1000 companies. Check out the full list of metros with links to the corresponding metro report.

The Metropolitan Area Situation & Outlook Reports provide insights into the integrated mix of of geographic, demographic, economic and business activity and patterns for individual metropolitan areas. The reports provide a summary of Fortune 1000 companies, notable businesses, government operations and other entities impacting the metro.

This section provides a summary of the number of Fortune 1000 companies derived from individual metro reports. 152 metros have one or more Fortune 1000 companies with headquarters in the metro. View the list of metros showing the number of companies as described below.

Fortune 1000 Companies by Metro
The graphic below shows Fortune 1000 companies as red markers in context of metropolitan statistical areas. Company addresses were geocoded, determining census block code. From the census block code, the county and metro were assigned.

– View developed using CV XE GIS and related GIS project.
– Click graphic for larger view and bolder metro outlines.

Number of Fortune 1000 Companies by Metro
The graphic presented below shows the metros having the largest number of Fortune 1000 companies. See the full list in the related Web section. On that page, click a link to view Metro Report and list of Fortune 1000 companies located in the report (section 2). To look up metros of interest, use the all metros table.

See the related Web section for more details.

About the Author
— Warren Glimpse is former senior Census Bureau statistician responsible for innovative data access and use operations. He is also the former associate director of the U.S. Office of Federal Statistical Policy and Standards for data access and use. He has more than 20 years of experience in the private sector developing data resources and tools for integration and analysis of geographic, demographic, economic and business data. Contact Warren. Join Warren on LinkedIn.

American Community Survey 2014: New Resources for Data Analytics

.. to pick one geography among many important types of geographies, how has educational attainment changed by metro since 2010? .. median household income? .. median housing value? How do metros compare among peer group metros? Data required to answers these questions are only available from the Census Bureau American Community Survey (ACS).

New ACS 2014 Data Now Available
The American Community Survey 1-year estimates became available today, September 17, 2015. See details — ACS 2014 data access, integration and use. These demographic-economic estimates are released annually in September and are essential in many Data Analytics applications. The 1-year estimates are available for geographic areas having 65,000 population or more and reflect characteristics for the survey period January through December 2014.

2014 Median Household Income by Metro
The following graphic illustrates use of the ACS 2014 data to develop a thematic pattern map of median household income by metro (515 metros that have 65,000 or more population). This graphic makes use of one subject matter item among hundreds of ACS subject matter items tabulated. Click graphic for larger view showing legend and mini profile example.

— view developed using CV XE GIS software and related GIS project.

  • See more about the scope of subject matter tabulated.

  • See more about the scope of geographic tabulation areas.

ACS & Data Analytics
Data Analytics can help most any organization more effectively reach goals and objectives. Whether a new or established business, serving a county or national market, similar tools and methods apply. The ACS data provide one important part of the data for Data Analytics. Subsequent posts will illustrate how to integrate ACS data with other data to gain important insights.

About the Author
— Warren Glimpse is former senior Census Bureau statistician responsible for innovative data access and use operations. He is also the former associate director of the U.S. Office of Federal Statistical Policy and Standards for data access and use. He has more than 20 years of experience in the private sector developing data resources and tools for integration and analysis of geographic, demographic, economic and business data.