Category Archives: VDA

Finding & Viewing a Census Tract

.. this section reviews how you can locate a census tract, neighborhood area, for an address or location. Do this with Open VDA Web GIS (OVDAW) with only a browser and Internet connection. No registration, no login, nothing to install. Start OVDAW .. an interactive map appears in a new window. There is no warranty for any aspect of this or related sections. The user is solely responsible for any use made of this or related sections, tools, data.

After the map view shows, enter a ZIP code, location or address in the Search bar and press enter.
.. to illustrate, enter 85258 (a ZIP code in Scottsdale, AZ) and press enter.
A zoom-in then shows a blue triangle marker at the location.
.. in the legend panel at left, click checkbox on for each of these layers:
– ZIP Codes Label (displays ZIP Code area labels/codes in map)
– ZIP Codes (displays ZIP Code area red boundaries in map)
– Tracts Label (displays Tract code and black tract boundaries in map)
.. navigate to preferred view (e.g., pan or zoom in/out)
.. use a screen capture tool to capture view meeting application objective

Pointer in graphic shows ZIP code 85258 with several tracts intersecting the 85258 ZIP code red boundary.

Or .. skip the settings and simply click the marker.
.. the tract area shows as cross-hatched.
.. the tract code and demographic profile shows in lower left panel.
.. optionally click the HTML button below profile panel to view profile as HMTL table.

ZIP Code- Census Tract Equivalence Table
Use this interactive table to view what census tracts intersect with a ZIP code or what ZIP codes intersect with a census tract. Use buttons below the table.

Updates on using VDAGIS with ZIP code and census tract data will be included in forthcoming Blogs. Don’t miss out! Click Follow in button at upper right.

About VDA GIS
Use VDA GIS tools to meet wide-ranging mapping needs and geospatial analysis. VDA Desktop GIS and VDA Web GIS have similar features that can be used separately or together. Each is a decision-making information resource designed to help stakeholders create and apply insight. VDA Web GIS is access/used with only a Web browser; nothing to install; GIS experience not required. VDA Desktop GIS is installed on a Windows computer and provides a broader range of capabilities compared to VDA Web GIS. VDA GIS resources have been developed and are maintained by Warren Glimpse, ProximityOne (Alexandria, VA) and Takashi Hamilton, Tsukasa Consulting (Osaka, Japan).

Data Analytics Web Sessions
Join us in the every Tuesday, Thursday Data Analytics Web Sessions. See how you can use VDA Web GIS and access different subject matter for related geography. Get your geographic, demographic, data access & use questions answered. Discuss applications with others.

About the Author
Warren Glimpse is former senior Census Bureau statistician responsible for national scope statistical programs and innovative data access and use operations. He is also the former associate director of the U.S. Office of Federal Statistical Policy and Standards for data access and use. He has more than 20 years of experience in the private sector developing data resources and tools for integration and analysis of geographic, demographic, economic and business data. Join Warren on LinkedIn.

Using VDA Desktop GIS with Remote Desktop

.. make reference and geostatistical maps using the VDA Desktop GIS online via our Remote Desktop Service. Perform simple, easy-to-use mapping tasks, or more advanced geospatial analyses. VDA .. Visual Data Analytics. GIS .. Geographic Information Systems. Here I review how to do this with only Internet and most any device. VDA Desktop GIS and associated “Base” project provides access to the Federal Statistical System and much more.

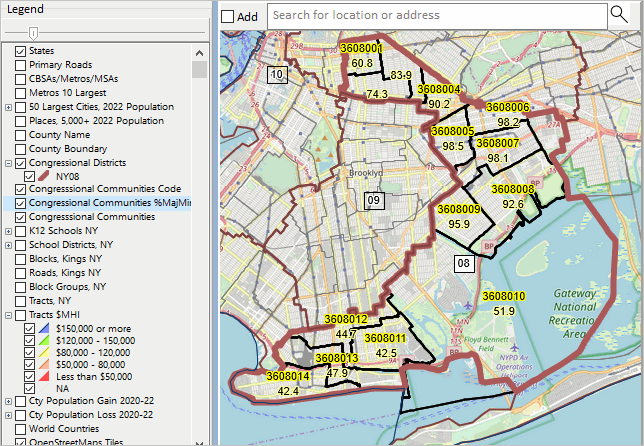
New York Congressional District 08 by Congressional Community .. an example
.. CD NY08 with CCs labeled with %Majority Minority .. click for larger view

How to use Remote Desktop Service Remote Desktop was envisioned as a protocol to connect a user’s desktop/device via Internet to a remote computer so that the user could access, run, use their files on the remote computer. Remote Desktop Service (RDS) provides far greater capabilities. In our case, we have installed VDA Desktop GIS (VDAD) on the Server enabling a user to run VDAD as if it were operating on the user’s computer. This enables a user to run VDAD 1) without installing anything and 2) using VDAD, a Windows-based program, on Macs, iOS and other devices.

Using VDAD with Remote Desktop Service
Start Remote Desktop Service. If this is the first time used, after starting RDS click the Add PC on the RDS interface, then key in the Server IP address .. 50.62.180.232. Next click the Server graphic. Next login using your userid and password. If needed, register here to get your userid and password. No fee. After logging in, click the VDAGIS icon to start VDAD.

VDAD Start-up View
Start up view shows counties; 48 contiguous states .. click for larger view

See more about using VDAD via RDS

Updates on using VDA Desktop GIS will be included in forthcoming Blogs.
Don’t miss out! Click Follow in button at upper right.

About VDA GIS
Use VDA GIS tools to meet wide-ranging mapping needs and geospatial analysis. VDA Desktop GIS and VDA Web GIS have similar features that can be used separately or together. Each is a decision-making information resource designed to help stakeholders create and apply insight. VDA Web GIS is access/used with only a Web browser; nothing to install; GIS experience not required. VDA Desktop GIS is installed on a Windows computer and provides a broader range of capabilities compared to VDA Web GIS. VDA GIS resources have been developed and are maintained by Warren Glimpse, ProximityOne (Alexandria, VA) and Takashi Hamilton, Tsukasa Consulting (Osaka, Japan).

Data Analytics Web Sessions
Join us in the every Tuesday, Thursday Data Analytics Web Sessions. See how you can use VDA Web GIS and access different subject matter for related geography. Get your geographic, demographic, data access & use questions answered. Discuss applications with others.

About the Author
Warren Glimpse is former senior Census Bureau statistician responsible for national scope statistical programs and innovative data access and use operations. He is also the former associate director of the U.S. Office of Federal Statistical Policy and Standards for data access and use. He has more than 20 years of experience in the private sector developing data resources and tools for integration and analysis of geographic, demographic, economic and business data. Join Warren on LinkedIn.

New 2023 Metropolitan Area Delineations

.. new 2023 CBSA/metro delineations have just been released. See more about the 2023 delineations. Core-Based Statistical Areas (CBSAs) are officially designated by the U.S. Office of Management and Budget (OMB). CBSAs are composed of one or more contiguous counties and must meet a population size criteria of associated Urban Area(s). CBSAs are classified as the larger Metropolitan Statistical Areas (MSAs; 387 in United States and 6 in Puerto Rico) and smaller Micropolitan Statistical Areas (MISAs; 538 in United States and 4 in Puerto Rico). Use the interactive table to view, rank, query 2023 CBSAs by component area.

These changes can have a profound impact on matters including policy formulation, resource allocation, general research .. to name a few. If you have data by metro, and the geography of the metro changes over time, analytical results, trend implications, can be very misleading. But there’s more.

Two notable aspects about the new 2020 CBSA standards, used for the 2023 delineations, are that they 1) no longer make use of NECTAs (New England City and Town Areas) and 2) the qualifying core population is now based on the population size of the relevant Urban Area(s) rather than cities.

The Houston, TX Metro — an Illustrative Example
The Houston, TX metro (MSA) changed from 9 counties based on the 2020 CBSA delineations to 10 counties based on the 2023 delineations. As shown in the graphic below, San Jacinto County, TX was added. The bold orange boundary shows the 2023 delineations. The black bold boundary shows the 2020 delineations. Note that four counties contiguous to the Houston MSA became MSAs effective with the 2023 delineations. These counties were classified as MISAs before the 2023 delineation.

CBSA/Metro Mapping & GeoSpatial Analysis
View and examine the 2020 and 2023 vintage CBSAs using the VDA Web GIS with the MetroDynamics GIS project. Examine metros in context of other geography. Click here to start VDA Web GIS; uses a browser, nothing to install. Use the spreadsheet/grid feature to examine the metros in a tabular manner.

About VDA GIS
Use VDA GIS tools to meet wide-ranging mapping needs and geospatial analysis. VDA Desktop GIS and VDA Web GIS have similar features that can be used separately or together. Each is a decision-making information resource designed to help stakeholders create and apply insight. VDA Web GIS is access/used with only a Web browser; nothing to install; GIS experience not required. VDA Desktop GIS is installed on a Windows computer and provides a broader range of capabilities compared to VDA Web GIS. VDA GIS resources have been developed and are maintained by Warren Glimpse, ProximityOne (Alexandria, VA) and Takashi Hamilton, Tsukasa Consulting (Osaka, Japan).

Data Analytics Web Sessions
Join us in the every Tuesday, Thursday Data Analytics Web Sessions. See how you can use VDA Web GIS and access different subject matter for related geography. Get your geographic, demographic, data access & use questions answered. Discuss applications with others.

About the Author
Warren Glimpse is former senior Census Bureau statistician responsible for national scope statistical programs and innovative data access and use operations. He is also the former associate director of the U.S. Office of Federal Statistical Policy and Standards for data access and use. He has more than 20 years of experience in the private sector developing data resources and tools for integration and analysis of geographic, demographic, economic and business data. Join Warren on LinkedIn.

School District Geography & GeoSpatial Analysis

.. the approximate 100,000 K-12 public schools, 13,000 school districts and 50 million school age children in the United States touch nearly every dimension of society and the economy. This section reviews the scope of school district geography as cachement areas for the K-12 public schools and school age population .. and tools to examine them in an integrated and holistic manner. How does school district instructional expenditure relate to the demographic-economic make-up of the district? Educational outcomes? How are leaders and educators equipped to make effective use of these tools and data?

School districts are geographic areas covering the U.S. to provide public K-12 education. I developed the first national scope school district boundary file in the mid-1990s, a joint project of the U.S. National Center for Education Statistics and the Census Bureau. School district boundaries are now updated annually as a part of the Census Bureau TIGER digital map database under the sponsorship of the U.S. National Center for Education Statistics (NCES). School district names, codes, enrollment by grade and many other attributes are updated annually as a part of the NCES Common Core of Data (CCD). The 2021-22 (latest data as of this time) school district CCD administrative data provides data for approximately 13,025 “regular” school districts. The CCD data are one type of data that can be merged (based on a common key of the NCES assigned local education ID) with TIGER-based school district shapefiles that can enable mapping and geospatial analysis. Using these shapefiles with Geographic Information System (GIS) software users can examine maps of districts by name, view boundaries or patterns such the per pupil instructional expenditure.

Types of School Districts
School districts, whose boundaries and operations are defined and managed by individual states, often exist as three types of school districts in differing combinations: elementary, secondary and unified. Some states have only unified school districts that are also the same as the counties (such as Florida, Kansas, Maryland and Nevada). California has perhaps the most complex array of mixed elementary, secondary and unified districts.

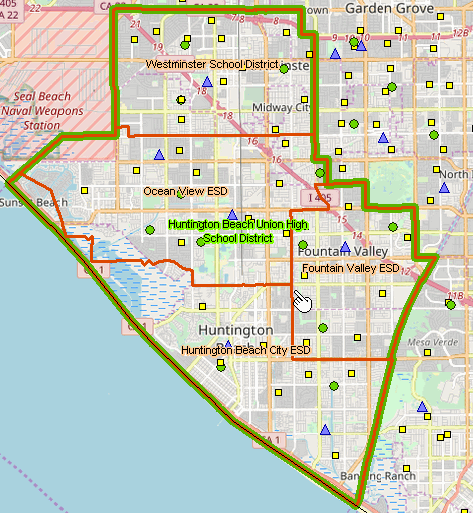
Huntington Beach, CA School Districts
The following view shows how 4 elementary districts (orange boundaries) each offering grades K-8 education collectively cover the same ground area as 1 secondary district, Huntington Beach Unified High School District (green bold boundary) offering grades 9-12 education.

K-12 School & School District GIS Project
The VDA GIS ready to use K-12 School & School District GIS project with CV XE GIS, VDA Desktop GIS or the VDA Web GIS to examine and geospatially analyze school districts and school district attributes in context of other geography and subject matter. For example, the following view shows patterns of neighborhood economic prosperity (median household income by census tract) for the Huntington Beach, CA school districts. Click graphic for larger view.

Viewing Your School District
To view your school district, follow these steps:
Start VDA Web GIS
Select the “K-12 Schools & School Districts” project.
When the map view opens
.. uncheck School District Elementary and School District Secondary
    in Legend Panel at left
Enter address in Search box above map (Apple Headquarters in this example)
Press enter and this view appears .. click blue triangle to view profile.
.. see that this district is Santa Clara Unified ..

About VDA GIS
There are two VDA GIS tools that have similar features that can be used separately or together. Each is a decision-making information resource designed to help stakeholders create and apply insight. VDA Web GIS is access/used with only a Web browser; nothing to install; GIS experience not required. VDA Desktop GIS is installed on a Windows computer and provides a broader range of capabilities compared to VDA Web GIS. VDA GIS resources have been developed and are maintained by Warren Glimpse, ProximityOne (Alexandria, VA) and Takashi Hamilton, Tsukasa Consulting (Osaka, Japan).

Data Analytics Web Sessions
Join us in the every Tuesday, Thursday Data Analytics Web Sessions. See how you can use VDA Web GIS and access different subject matter for related geography. Get your geographic, demographic, data access & use questions answered. Discuss applications with others.

About the Author
Warren Glimpse is former senior Census Bureau statistician responsible for national scope statistical programs and innovative data access and use operations. He is also the former associate director of the U.S. Office of Federal Statistical Policy and Standards for data access and use. He has more than 20 years of experience in the private sector developing data resources and tools for integration and analysis of geographic, demographic, economic and business data. Join Warren on LinkedIn.
Measuring & Analyzing Households by Social Class by PUMA

.. a social class is a population or household group typically referred to as a lower, middle and upper class. The size of the population or households in a social class is often determined in relationship to an interval related to the median household income of an area — from two-thirds of median household income to twice the median household income (MHI). Subsequent blog posts will address a broader definition for class determination. By better understanding composition and determinants of social class for an area, we might better understand and improve on income inequality and create new opportunities. This is a multi-part blog post on social class analytics. Click Follow at right to receive updates.

Percent Population in Households by Social Class by PUMA
.. Los Angeles area .. click for larger view.

Los Angeles metro area by social class .. PUMAs shown with black boundaries; pointer at Los Angeles-Orange County line

Percent of Households by Social Class by PUMA
.. Los Angeles area .. click for larger view.

Los Angeles metro area by social class .. PUMAs shown with black boundaries; pointer at Los Angeles-Orange County line

Using American Community Survey Microdata
We use of the American Community Survey microdata or “public use microdata samples” (PUMS) http://proximityone.com/pums.htm to develop estimates of population and households by middle class, lower class and upper class by “public use microdata area” (PUMA) http://proximityone.com/puma.htm. Microdata files are comprised of anonymized individual respondent data within PUMAs. The approximate 2,800 PUMAs cover the U.S. wall-to-wall and must have 100,000 population or more. 2010 and 2020 vintages PUMAs may be examined and compared with other geography using the VDA Web GIS http://proximityone.com/vda.htm with the MetroDynamics Project.

Social Class Participation by PUMA
Using custom software, the PUMA (ACS 2021 1 year data in this case), individual housing records are summarized for each PUMA. An estimate is developed for the lower, middle and upper class based on an algorithm.

Examine patterns of social class stratification using VDA Web GIS anywhere in U.S.
The estimates are then integrated into a PUMA shapefile. The PUMA shapefile is added to a Geographic Information System (GIS). Access this shapefile/layers using VDA Web GIS to examine patterns of social class, such as the graphics shown above, or in combination with other geography and subject matter.

About VDA GIS
VDA Web GIS is a decision-making information resource designed to help stakeholders create and apply insight. Use VDA Web GIS with only a Web browser; nothing to install; GIS experience not required. VDA Web GIS has been developed and is maintained by Warren Glimpse, ProximityOne (Alexandria, VA) and Takashi Hamilton, Tsukasa Consulting (Osaka, Japan).

Data Analytics Web Sessions
Join us in the every Tuesday, Thursday Data Analytics Web Sessions. See how you can use VDA Web GIS and access different subject matter for related geography. Get your geographic, demographic, data access & use questions answered. Discuss applications with others.

About the Author
Warren Glimpse is former senior Census Bureau statistician responsible for national scope statistical programs and innovative data access and use operations. He is also the former associate director of the U.S. Office of Federal Statistical Policy and Standards for data access and use. He has more than 20 years of experience in the private sector developing data resources and tools for integration and analysis of geographic, demographic, economic and business data. Join Warren on LinkedIn.

Examining City GeoDemographic Drilldown; Intersecting Tracts and Places

.. how can “our city” do a better job of providing housing for low-income individuals and families? One part of a successful program involves looking at attributes of the neighborhood, or census tract, geography across the city. We need to analyze needs by city component census tracts, areas averaging 4,000 population. Here is how that might be approached — determining which census tracts. And while this applies to low income housing, it applies to many other planning topics.

Relate census tract geography to city/place geography using GIS tools for analytical purposes … determine which tracts intersect a city/place. This section considers intersecting tracts and places for illustrative purposes. But the methodology, and tools to do this, involve many, many other types of geography .. geographic spatial intersection. The inputs in this case are U.S. national scope 2020 census tracts (85,190 areas covering the U.S. wall-to-wall) and U.S. national scope 2020 places (32,188 areas). The output from the process of intersecting these geographies are tract-place intersecting parts (119,906 areas). There are 32,146 tracts that are wholly contained in places.

Developing Intersect Files
Tracts intersecting with cities can be determined using the VDAGIS Intersect tool. Select the two input shapefiles and name the intersect output shapefile. The intersect shapefile is added to the GIS project being used.

Focusing on a City
What tracts intersect a city of interest? By having this information, stakeholders, policymakers can study and better understand inequities, differences and needs across the city. Consider Santa Ana, CA (Orange County). There are 65 tracts that intersect with the city of Santa Ana. This could be any city across America. The following view shows Santa Ana with intersecting tracts.

By viewing the intersecting file in VDAGIS, intersecting tracts can be examined. The graphic below shows a zoom-in to tract 06059089102 (blue boundary). This tract is shown at the pointer in the above graphic. in the following zoom-in view, the white label shows the tract code for the whole tract and the two split parts are shown with the same code. The part to the right in Santa Ana city, the part to the left is in Garden Grove city.

Using the intersecting file, the list (a partial list) of these tracts and tract codes can be determined as shown below. By knowing the tract codes, detailed demographic-economic data can be pulled using DEDE and tract characteristics can be studied. Inequities ab be examined, special needs can be determined, east versus west tract groups might identify patterns to facilitate collaboration and policy development. What are the patterns of affordable housing across the city?

About VDAGIS
VDA Web GIS is a decision-making information resource designed to help stakeholders create and apply insight. Use VDA Web GIS with only a Web browser; nothing to install; GIS experience not required. VDA Web GIS has been developed and is maintained by Warren Glimpse, ProximityOne (Alexandria, VA) and Takashi Hamilton, Tsukasa Consulting (Osaka, Japan).

About the Author
Warren Glimpse is former senior Census Bureau statistician responsible for national scope statistical programs and innovative data access and use operations. He is also the former associate director of the U.S. Office of Federal Statistical Policy and Standards for data access and use. He has more than 20 years of experience in the private sector developing data resources and tools for integration and analysis of geographic, demographic, economic and business data. Join Warren on LinkedIn.

Population Living Alone & Age 65 Years and Over

.. how many people are living alone in your community, neighborhood? How does this population impact the community? What are their special needs? How does this population vary by area and population group? There were 37.9 million one-person households, 29% of all U.S. households in 2022. In 1960, single-person households represented only 13% of all households. These estimates are based on the 2022 Current Population Survey (CPS). Moving forward, the number of one-person households, people living alone, will increase at the rate of one million or more per year. People in households exclude people living in group quarters. This post examines patterns of people living alone with focus on people living alone age 65 year and over and distribution by small area geography.

While the CPS data provide a current snapshot of the number of people living alone, we have to use data from the American Community Survey to obtain data for smaller area geography like counties and census tracts.

Population Living Alone by Census Tract –Visual Data Analytics
The four graphics below show patterns of the population living alone by census tract. These views have been developed using the Visual Data Analytics (VDA GIS) tools with integrated demographics. Develop variations on these views using the VDA Web GIS using only a web browser.

Patterns of Population Living Alone by Tract

.. click graphic for larger view.

Patterns of Population 65 and Over Living Alone by Tract

.. click graphic for larger view.

Patterns of Population Living Alone by Tract — Houston Metro Area

Patterns of Population 65 and Over Living Alone by Tract — Houston Metro Area

Examine the Data in More Detail
As noted in this related New York Times story, nearly 26 million Americans 50 or older now live alone, up from 15 million in 2000. Older people have always been more likely than others to live by themselves makes up a bigger share of the population than at any time in the nation’s history. The trend has also been driven by deep changes in attitudes surrounding gender and marriage. People 50-plus today are more likely than earlier generations to be divorced, separated or never married. Similar ACS data as used to develop the graphics shown above are available by race/origin. These data are based on the ACS 2020 data; the same scope of data will be available from ACS 2021 to be released in December 2022.

About VDA GIS
VDA Web GIS is a decision-making information resource designed to help stakeholders create and apply insight. Use VDA Web GIS with only a Web browser; nothing to install; GIS experience not required. VDA Web GIS has been developed and is maintained by Warren Glimpse, ProximityOne (Alexandria, VA) and Takashi Hamilton, Tsukasa Consulting (Osaka, Japan).

About the Author
Warren Glimpse is former senior Census Bureau statistician responsible for national scope statistical programs and innovative data access and use operations. He is also the former associate director of the U.S. Office of Federal Statistical Policy and Standards for data access and use. He has more than 20 years of experience in the private sector developing data resources and tools for integration and analysis of geographic, demographic, economic and business data. Join Warren on LinkedIn.

Personal Economic Well-Being

.. examining characteristics, patterns and change in personal economic well-being; learning about what per capita personal income by county tells us. Per capita personal income (PCPI) is the best single measure of personal economic well-being. PCPI differs American Community Survey (ACS) measure of per capita income, median household income and similar income measures as PCPI includes non-monetary income .. PCPI provides a more comprehensive measure. This post provides an update focused on new data released November 2022, county level personal income time series data starting in 1969.

Patterns of 2021 Per Capita Personal Income by County

.. click graphic for larger view
.. use VDA Web GIS for Web-based interactive viewing/analytics.
.. see this more detailed analytical framework for analytics using VDA Desktop.

Importance of these Data
How is the regional economy doing? How is it trending? What policies might be changed to improve personal economic well-being? Answers to these and similar questions are why knowing about personal income and its derivation, components is important — to residents, businesses and governments. While median household income is often considered the best measure of buying power for an area, it is not the best measure of personal or household economic well-being. PCPI and the Regional Economic Information System provides insights and answers to these questions.

U.S. Change in PCPI
In U.S. metropolitan areas, PCPI increased 7.3 percent in 2021, up from 6.0 percent in 2020. In U.S. nonmetropolitan areas, PCPI increased 7.5 percent, down from 7.9 percent.

Regional Economic Information System
PCPI is a small part of the broader Regional Economic Information System (REIS). The following links show examples of detailed tables for Harris County, TX comparing 2019 and 2021 developed using the ProximityOne REIS package. Develop these profiles for any county for your selected year 1970 through 2021.
  • Personal Income by Major Source
  • Earnings by Source & Sector
  • Employment by Type & Sector
  • Transfer Payments
  • Economic Profile
  • Farm Income & Expenditures

About VDA GIS
VDA Web GIS is a decision-making information resource designed to help stakeholders create and apply insight. Use VDA Web GIS with only a Web browser; nothing to install; GIS experience not required. VDA Web GIS has been developed and is maintained by Warren Glimpse, ProximityOne (Alexandria, VA) and Takashi Hamilton, Tsukasa Consulting (Osaka, Japan).

About the Author
Warren Glimpse is former senior Census Bureau statistician responsible for national scope statistical programs and innovative data access and use operations. He is also the former associate director of the U.S. Office of Federal Statistical Policy and Standards for data access and use. He has more than 20 years of experience in the private sector developing data resources and tools for integration and analysis of geographic, demographic, economic and business data. Join Warren on LinkedIn.

Naturally Occurring Retirement Communities in Path of Hurricane Ian

.. 25.8 million U.S. households had a head of household age 65 years or over in 2010; 22.1% of total households. 3.1 million households with head of household 65 years or over were located in 10,201 “naturally occurring retirement communities” (NORCs) — areas where the percent of head of household age 65 or over is 40 percent or more. Has the number of NORCs tripled by now? Where and how much .. a next blog.

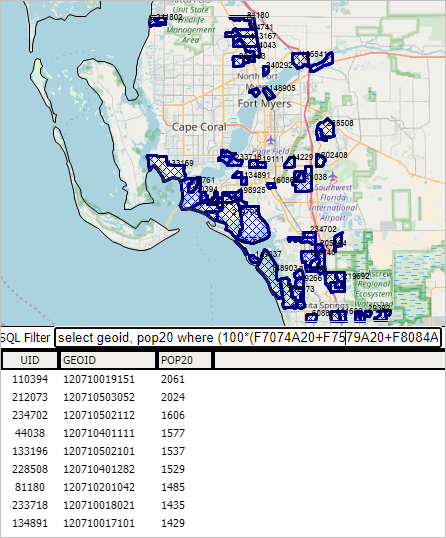
Here, we review Naturally Occurring Retirement Communities in the Path of Hurricane Ian by block group (BGs) in Lee County, FL … using VDA Web GIS. The same process can be applied to any area.

The following view shows a map view of the BGs meeting the criteria. A partial list of the BGs are shown in the table below the map. In the graphic, BGs meeting the criteria show with blue cross-hatch. Zoom in, label, get a profile if viewing real-time. In the graphic, for example, BG 120710019151 (state 12, county 171, tract 001951, BG code 1) has a total Census 2020 population of 2,061.

vda_lee_norc_bgs

Step-by-Step Guide
See this VDA Web GIS tutorial showing how to develop a similar view for areas of interest.

About VDA Web GIS
VDA Web GIS is a decision-making information resource designed to help stakeholders create and apply insight. VDA Web GIS has been developed and is maintained by Warren Glimpse, ProximityOne (Alexandria, VA) and Takashi Hamilton, Tsukasa Consulting (Osaka, Japan).

About the Author
Warren Glimpse is former senior Census Bureau statistician responsible for national scope statistical programs and innovative data access and use operations. He is also the former associate director of the U.S. Office of Federal Statistical Policy and Standards for data access and use. He has more than 20 years of experience in the private sector developing data resources and tools for integration and analysis of geographic, demographic, economic and business data. Join Warren on LinkedIn.

Real Quarterly GDP Trends: State of the States

.. real gross domestic product (RGDP) decreased in 46 states and DC in 2022Q1, as real GDP for the nation decreased at an annual rate of 1.6 percent. The percent change in real GDP in 2022Q1 ranged from 1.2 percent in New Hampshire to 9.7 percent in Wyoming. Updated quarterly GDP estimates have only a 3-month lag from the reference date (e.g., 2022Q1) to access date (e.g. June 2022). Used as a time series, these data provide insights into recent economic change and prospective future change. The RGDP estimates are developed by sector, enabling an assessment of which and how sectors are contributing to change. While we look at all states in this post, California is used as an example. Examine your state(s) of interest using the tools and data described here.

See this companion video illustrating some aspects of using VDA Web GIS with the state quarterly GDP.

Analyzing Real Quarterly GDP by State Using VDA MetroDynamics
Percent Change in Real GDP, 2021Q1 to 2022Q1, U.S. by State

.. create variations of this view using VDA Web GIS .. nothing to install.
.. about MetroDynamics GIS Project
.. click here to start VDA Web GIS

Examine Real Quarterly GDP by State by Sector
GDP is estimated quarterly for 21 sectors. the following graphic shows quarterly RGDP by sector for California. Use VDA to examine these data for state(s) of interest. Step-by-step how-to details below.

View the above data as an Excel file (save to file and open with Excel).

Using VDA Web GIS to Examine GDP by State – Mapping Patterns
Follow these steps:
Start VDA Web GIS
– Select MetroDynamics Project in next form.
.. VDA user interface appears
– select States in upper left dropdown
– in legend panel, uncheck “Metros Base ..”
– in legend panel, check the top 4 States layers on
– in legend panel, check “+” by “St RGDP%Ch 21q1-22q1” layer name
.. view now shows similar to view presented above.

– click a state to view a profile of the demographic-economic attributes.
.. the profile appears in lower left panel.
.. click the HTML button, lower left, to view the attributes in HTML format.

Using VDA Web GIS to Examine GDP by State — Table/Query
Complete the above steps, then click Query/Table button (below map at right)
– a table/grid now shows below the map window
.. the table has a row for each state; columns show subject matter items
– use Select Field button to select only a few items:
  .. state name
  .. RGDP2021Q1
  .. RGDP2022Q1
  .. RGDP2021Q1-2022Q1 change
  .. RGDP2021Q1-2022Q1 % change
.. table refreshes with view shown below (sorted on RGDP2021Q1-2022Q1 % change).

Looking Ahead; Updates
New quarterly GDP by state estimates for 2022Q2 and revised annual GDP by state estimates for 2017 to 2021 and will be released on September 30, 2022.

About GDP and Measurement
State GDP estimates are updated quarterly by the U.S. Bureau of Economic Analysis (BEA). The following terminology may be a useful reference.
Gross domestic product (GDP) by state is the market value of goods and services produced by the labor and property located in a state. GDP by state is the state counterpart of the nation’s gross domestic product, the most comprehensive measure of U.S. economic activity.
Current-dollar statistics are valued in the prices of the period when the transactions occurred—that is, at “market value.” Also referred to as “nominal GDP” or “current-price GDP.”
Real GDP values are inflation-adjusted statistics, these values exclude the effects of price changes.
State GDP is the lowest geographic level for which quarterly estimates of GDP are produced by BEA.
Seasonal adjustment and annual rates. Quarterly values are expressed at seasonally adjusted annual rates.
Quantities and prices. Quantities, or “real” measures, are expressed as index numbers with a specified reference year equal to 100 (currently 2012). Quantity indexes are calculated using a Fisher-chained weighted formula that incorporates weights from two adjacent periods (quarters for quarterly data and annuals for annual data). “Real” dollar series are calculated by multiplying the quantity index by the current dollar value in the reference year and then dividing by 100. Percent changes calculated from chained-dollar levels and quantity indexes are conceptually the same. Chained-dollar values are not additive, because the relative weights for a given period differ from those of the reference year.
Chained-dollar values of GDP by state are derived by applying national chain-type price indexes to the current dollar values of GDP by state for the 21 North American Industry Classification System-based industry sectors. The chain-type index formula that is used in the national accounts is then used to calculate the values of total real GDP by state and real GDP by state at more aggregated industry levels. Real GDP by state may reflect a substantial volume of output that is sold to other states and countries. To the extent that a state’s output is produced and sold in national markets at relatively uniform prices (or sold locally at national prices), real GDP by state captures the differences across states that reflect the relative differences in the mix of goods and services that the states produce. However, real GDP by state does not capture geographic differences in the prices of goods and services that are produced and sold locally.

About VDA Web GIS
VDA Web GIS is a decision-making information resource designed to help stakeholders create and apply insight. VDA Web GIS has been developed and is maintained by Warren Glimpse, ProximityOne (Alexandria, VA) and Takashi Hamilton, Tsukasa Consulting (Osaka, Japan).

About the Author
Warren Glimpse is former senior Census Bureau statistician responsible for national scope statistical programs and innovative data access and use operations. He is also the former associate director of the U.S. Office of Federal Statistical Policy and Standards for data access and use. He has more than 20 years of experience in the private sector developing data resources and tools for integration and analysis of geographic, demographic, economic and business data. Join Warren on LinkedIn.