Tag Archives: Census 2020

Congressional Districts & Congressional Community Web Sessions

.. did you know? .. 19 congressional districts have lost more than 4% population since 2020? Which ones? What is causing the loss? How is the loss distributed across the district? Will these trends continue? Which districts are growing? Based on the 2020 Census, the Diversity Index for the 118th Congressional Districts ranged from 12.5% (Kentucky 05) to 78.5% (Hawaii 02). What and why is the Diversity Index important? What are economic characteristics of districts? How can you have your voice better heard by Congress through a congressional communities? How can stakeholders easily relate diverse topics like school districts, K-12 education, urban/rural areas, low and moderate income by census tract, ZIP codes, state legilslative districts among others to congressional districts and congressional communities? Get answers here. Learn more about these topics in this session.

Join us in the every Wednesday Zoom web session
click here for 10/11/23 overview & connectivity details


Who Benefits?
 – strategists needing to understand demographic-economic change
 – policymakers and staff and stakeholders dealing with policy development
 – residents/constituents/participants in a congressional community
 – learners & researchers regarding CC, CD mapping & geodemographic topics

About Congressional Districts & Congressional Communities

Congressional Districts. The November 2022 elections determined the representatives for the 118th Congressional Districts (CDs) January 2023-December 2024 session. The 118th Congressional District boundaries reflect the redistricting process based on Census 2020 results.

Congressional Communities. Congressional Communities (CC) are a concept and development of Congressional Communities, a non-profit organization. CCs have been developed to better enable constituents to have their voice heard by policymakers and vice versa. The approximate 7,400 CCs cover the U.S. wall-to-wall developed by the CC team and typically range from 30,000 to 70,000 population. CCs have been developed based on several criteria and are not arbitrary subdivisions of CDs. There are a set of CCs that nest exactly within each CD. Demographic data have been developed for each CC based on Census 2020 census block data by the CC team.

CC stakeholders may map and geospatially analyze their CCs and CDs.
CC organizations are comprised of residents of their respective CCs.
join in to a CC here .. illustrative details for a CC

Four Topics in this Web Session
.. illustrative applications are focused on California CD 47.
.. Use your own CD/region of interest.
.. ~30 minute presentation followed by discussion.

1. CD/CC Visualization using the Open VDA Web GIS
.. click here to start Open VDA Web GIS (OVDAW) .. all you need is a browser
.. step-by-step example .. optionally follow-along

Patterns of %Population Change 2020-2022 by 118th Congressional District

.. learn how to develop variations of this view.

2. 118th Congressional Districts & 2020-2022 Demographics
.. Congressional Districts Main
.. using the CD Census 2020 & ACS 2022 interactive table

In August 2023, the Census Bureau released the first Census 2020 demographics for the 118th Congressional Districts. In September 2023, the Census Bureau released the American Community Survey 2022 1-year estimates (ACS2022) for the 118th Congressional Districts. These data provide reasonably current data on a myriad of socioeconomic data. The Census Bureau also maintains the official national scope boundary files (for mapping and geospatial analysis) for the 118th Congressional Districts.
The Census Bureau also develops the County Business Patterns data for the 118th Congressional Districts. Learn more about the scope of these data and how they can be accessed and used. Aside from these data resources, the Federal statistical system (FSS) produces very little data for congressional districts.

What can I learn? Scope of annual ACS-based subject matter.
General Demographics .. Social Characteristics .. Economic Characteristics .. Housing Characteristics

3. 118th Congressional District & Congressional Community Diversity
.. Congressional Districts Diversity
.. using the CD & CC interactive table

Patterns of Diversity by Congressional Community .. CA CD 47
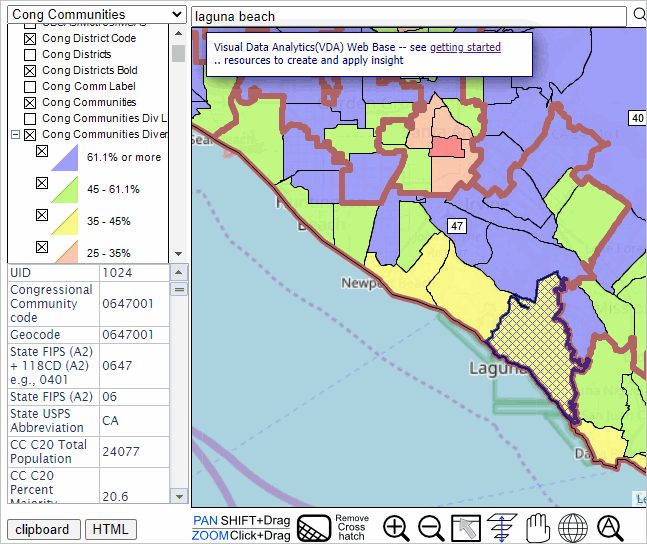
  .. learn how to develop variations of this view.


4. Comparative GeoDemographic Narrative Profiles

.. using Demographic Analytics (DA) tool to compare CDs, CCs, and other areas
.. Census 2020 “DHC” detailed data released 8/31/23
.. accessing the new Census 2020 DHC-based “Demographic Profile 1” (DP1)
.. examples — running DA
– CA CC 0647001 compared to CA CD 47 Tabular Report
– CA CC 0647001 compared to CA CD 47 Narrative Profile
.. creating tabular report and narrative profile for areas of interest.

About VDA GIS
Use VDA GIS tools to meet wide-ranging mapping needs and geospatial analysis. VDA Desktop GIS and VDA Web GIS have similar features that can be used separately or together. Each is a decision-making information resource designed to help stakeholders create and apply insight. VDA Web GIS is access/used with only a Web browser; nothing to install; GIS experience not required. VDA Desktop GIS is installed on a Windows computer and provides a broader range of capabilities compared to VDA Web GIS. VDA GIS resources have been developed and are maintained by Warren Glimpse, ProximityOne (Alexandria, VA) and Takashi Hamilton, Tsukasa Consulting (Osaka, Japan).

Data Analytics Web Sessions
Join us in the every Tuesday, Thursday Data Analytics Web Sessions. See how you can use VDA Web GIS and access different subject matter for related geography. Get your geographic, demographic, data access & use questions answered. Discuss applications with others.

About the Author
Warren Glimpse is former senior Census Bureau statistician responsible for national scope statistical programs and innovative data access and use operations. He is also the former associate director of the U.S. Office of Federal Statistical Policy and Standards for data access and use. He has more than 20 years of experience in the private sector developing data resources and tools for integration and analysis of geographic, demographic, economic and business data. Join Warren on LinkedIn.

Arizona’s Shifting Demographics

.. part of a state-by-state series .. these periodic posts examine how and why the state and its counties changed bwteen 2010 and 2020. Later posts will provide more of a drill-down look at change. Click the Follow link at right to receive new and updated information.

Census 2020 Arizona Demographics
The Arizona July 1, 2020 Census model-based population estimate of 7,421,401 compares to the Census 2020 population count of 7,151,502 people. The difference of -269,899 between the 2020 estimate and the 2020 count can be explained by several factors. First, the estimate is for a point in time that is three months later that the Census. There will be a tendency of the Census Bureau to adjust the Joly 1, 2020 population estimate to conform to the Census 2020 value. The July 1, 2020 estimate will likely be adjusted to reflect this change when the July 1, 2021 estimates are released April/May of 2022.

The 2020 population estimate is determined using a component method. The 2020 population estimate is the sum of the 2019 population estimate (7,291,843 for Arizona) and each of the following for the period July 1, 2019 through June 30, 2020 …
plus births (AZ 81,451)
less deaths (AZ 66,385)
plus international migration (AZ 9,272)
plus domestic migration (AZ 105,435)
plus an estimation residual (AZ -214)

Any one or a combination of these 6 estimate based values could be wrong, or the Census 2020 value could be wrong. It is likely a combination of all of these factors.

The remainder of this section is based on Census Bureau model-based estimates, released April 26, 2021. See more about these data for all U.S. counties in the Demographics 2060 section where Arizona demographic projections can be examined.

Visualizing Arizona Demographic Change
The following graphic illustrates how Arizona county demographics have changed from 2010 to 2020. The labels show the actual percent change; the color patterns, as shown in the legend, provide a visual thematic pattern view.

Examining the How and Why of Demographic Change
The following table shows a row for the state and each county, providing more detail as to the where, what/how much, how and why demographic change has occurred from 2010 to 2020.


Click graphic for larger view.

Looking Ahead
More geographically detailed data (counties for example) based Census 2020 (August 2021) will reveal much starker percentage differences between the 2020 estimates versus Census results. The ProximityOne annual estimates and projections to 2060 are developed using two basic series (and variation among those (low, base, high): Census 2020 based series and 2020 estimates series. See http://proximityone.com/demographics2060 for details.

Learn more — Join me in the Data Analytics Web Sessions
Join me in a Accessing & Using GeoDemographics Web Session where we discuss topics relating to measuring and interpreting the where, what, when, how and how much demographic-economic change is occurring and it’s impact.

About the Author
— Warren Glimpse is former senior Census Bureau statistician responsible for national scope statistical programs and innovative data access and use operations. He is also the former associate director of the U.S. Office of Federal Statistical Policy and Standards for data access and use. He has more than 20 years of experience in the private sector developing data resources and tools for integration and analysis of geographic, demographic, economic and business data. Contact Warren. Join Warren on LinkedIn.

Census 2020 – First Results

.. the first results of Census 2020, the apportionment data, were released on April 26, 2021.  Based on the decennial census, the United States total resident population increased from 308,745,538 (2010) to 331,449,281 (2020), a change of 22,703,743 (7.3%). For now, these data should be trusted and assumed accurate.  The apportionment data provide only total population counts at the state level.  More will be revealed about the accuracy of these data when the redistricting data are released in August 2021.

Apportionment of the U.S. House of Representatives
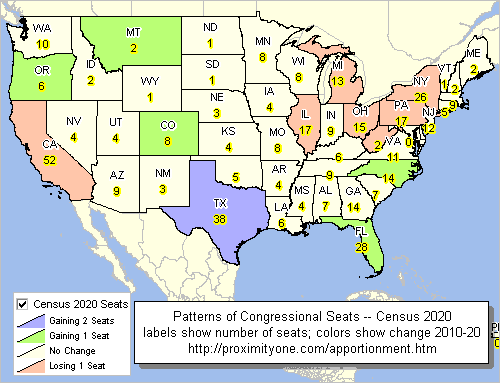
Congressional apportionment is the process of dividing the 435 members, or seats, in the House of Representatives among the 50 states based on the population data from the decennial census. See more about congressional districts and demographic-economic characteristics. See this related web section for detailed information on apportionment. Use the interactive table to view/analyze the Census 2010 and Census 2020 apportionment data. The following view shows patterns of congressional seats based on the decennial census. Labels show the number of seats based on the 2020 Census. Color patterns show the change in seats, 2010 to 2020.

Census 2020: the Process & Challenges
Counting the total population and selected population attributes in a pandemic is not only challenging but not possible.  During 2020, as the data were collected, it seemed good news that more than two-thirds of the potential respondents had completed the questionnaire.  But then the questions set in.  Bureau public announcements frequently made reference to the number or housing units and the number of households (occupied housing units) “accounted for” reaching 90 percent and progressively more.  By observation, using administrative record data, and other methods, housing units can be much more easily counted than the population and population attributes.  Likewise, determining the number households is  easier than determining the population count and characteristics.

The fact that the state population counts were unexpectedly different from the Bureau’s model based estimates is troubling.  We seek more assurance that the count of  population and population characteristics — by location — are as represented by the apportionment data.

Census Bureau 2020 Model-Based Estimates
New Census Bureau sourced U.S. by county model-based population estimates by age/gender/race-origin as of July 1, 2020 will be released by the Bureau in May 2021.  These estimates are independent of Census 2020 and make use of methods used annually throughout the 2010-2020 period.  An upcoming blog will report on ProximityOne’s analysis of these estimates in comparison with the Census 2020 data.

ProximityOne Estimates & Projections to 2060
ProximityOne annual demographic estimates and projections 2010-2060 by county will begin a new update cycle in May 2021.  The schedule is shown here.  

Starting with the May updates, two base projection series will be developed and progressively updated: one controlled to the Census 2020 data and one based on continued use of 2020 model-based estimates. As more information is released from Census 2020. Follow this blog for more information on evolving developments.

Learn more — Join me in the Data Analytics Web Sessions
Join me in a Accessing & Using GeoDemographics Web Session where we discuss topics relating to measuring and interpreting the where, what, when, how and how much demographic-economic change is occurring and it’s impact.

About the Author
— Warren Glimpse is former senior Census Bureau statistician responsible for national scope statistical programs and innovative data access and use operations. He is also the former associate director of the U.S. Office of Federal Statistical Policy and Standards for data access and use. He has more than 20 years of experience in the private sector developing data resources and tools for integration and analysis of geographic, demographic, economic and business data. Contact Warren. Join Warren on LinkedIn.

Census 2020 Residential Address Counts by Block

.. using Census 2020 residential address count data to examine change since 2010 .. the Census Bureau has released preliminary Census 2020 residential address counts by Census 2010 census block. These data, count of residential addresses and group quarters addresses, reflect updates as of October 2019 and do not represent final Census 2020 counts. The data will continue to be updated to support Census 2020. See related Web section with more detail and updates.

Importance and Use
These data are of immediate value in determining and analyzing how the number of housing units have changed, 2010 to 2019. Since the data are at the census block level, they may be aggregated to any other Census-defined summary level/type of geographic area such as block group, tract, ZIP code, city, county, school district, etc. These data are also important as they give us a “year in advance look” at how small area demographics are changing since 2010. Before this, the most recent census block data were from Census 2010. A lot has happened in many areas. These data provide insights into that change. The Census 2020 block level data will be released in early 2021 for Census 2020 census block geography. So, another important feature of these data is that they are summarized for Census 2010 census block boundaries. Census 2010 and 2020 block boundaries may differ, particularly in areas experiencing larger demographic growth/change. An important limitation is that they are counts, subject to change as the Census data are collected/tabulated.

Comparing Census 2010 Housing Units with Census 2020 Address Counts
The following graphic shows patterns of Census 2010 housing counts with the Census 2020 (late 2019 vintage) residential address counts by census block. This view is focused on census tract 3608100700 (tract 000700) in Queens County, NY (code shown near center of graphic). Individual blocks are labeled with block code (4 digits) with the Census 2010 housing units (yellow label) and Census 2020 residential address count (green label) shown below the block code. As an example, the block located at the pointer has block code 3006 (or full national scope unique block code 36-081-00700-3006) with a Census 2010 count 44 housing units and a Census 2020 (late 2019 count) of 232 residential addresses. Click graphic for larger view. Expand browser window to full screen for best quality view.

.. view created with ProximityOne CV XE GIS software and related GIS project.

More About Using these Data
We have summarized these data at the census tract level and are evaluating their use, in combination with other data, to develop current estimates and projections to 2025.

Data Analytics Web Sessions
Join me in a Demographics Analytics Lab session to discuss more details about accessing and using wide-ranging demographic-economic data and data analytics. Learn more about using these data for areas and applications of interest.

About the Author
— Warren Glimpse is former senior Census Bureau statistician responsible for innovative data access and use operations. He is also the former associate director of the U.S. Office of Federal Statistical Policy and Standards for data access and use. He has more than 20 years of experience in the private sector developing data resources and tools for integration and analysis of geographic, demographic, economic and business data. Contact Warren. Join Warren on LinkedIn.

The Value of Demographic Insights

.. its a global thing, a community thing, a business thing, a personal thing … demographics tell us about how, when, where we have changed and how we might change in the future .. and how that change might impact you .. us.

How & Why are County Demographics Changing?
The following graphic shows how counties have gained population (blue and green) and lost population (orange and red) during the period 2010 to 2018. Click graphic for larger view; expand browser window for best quality view. What are the insights from these data, this view? How are the insights developed? Their application and use creates the value. .
– developed using ProximityOne CV XE GIS.

Access these data for areas of interest:
– U.S. by state interactive table.
– U.S. by metro interactive table.
– U.S. by county interactive table.
– U.S. by city interactive table.
– U.S. by census tract interactive table.

An example of the “tip of the iceberg,” the above model-based demographic data have been developed for use in developing the more detailed American Community Survey annual demographic data — annual updates on demographics down to the block group level of geography. ~217,000 areas covering the U.S. wall-to-wall.

Valuation of Demographic Insights
Having the required demographic data is needed before value can be assigned to their use. It’s really not possible to value demographic data or insights on a financial basis alone. But here are some considerations. One way to assign a value to demographic data is on the cost basis. The above data have been developed by the Census Bureau. But they are not free to develop — the costs for the Federal programs to produce them and the cost for others providing access to the data and using them.

These demographic data enable an unestimable number of studies that result in an unestimable set of decisions in the private and public sector. Many evolve into useful insights, but certainly not all.

Census 2020 is will cost in excess of $16 billion. That’s just to get the data out there. The value of these demographic data have to be in the many trillions or much more. Plus, these demographics enable things that can be done that cannot be done with any other set of demographic data. This “uniqueness thread” runs through many demographic data programs. What is the value of being able to apportion Congress, state legislatures and thousands of other governmental bodies?

How to assign value to one decision based substantially on geodemographics?

What about the byproducts? Census 2020 relies heavily on the Census produced (with the indispensable involvement of regional governments) TIGER/Line geographic database. In essence, we have a demographic data program producing a geographic database. It can be argued that the public use TIGER database is the most valuable past of the decennial census. TIGER provides the digital map database undergirding all widely used mapservers such as Google maps and Bing. It provides the unique and near comprehensive set of standardized geographic data going down to the intersection-to-intersection street segment. It enables a near infinite set of Geographic Information System (GIS) applications.

The above addresses mainly matters of demographic data developed on a national scale. All businesses deal in their own demographics daily. This set of demographic data minimally includes staff and related consultants, etc. plus prospects and clients/customers. Many businesses do not take advantage of the potential benefits of having these data. They can often do more to use their own data, and data of competitors and about the market, to develop improved plans to meet their goals.

Demographic Analytics Web Sessions
Join me in a Demographics Analytics Lab session to discuss more details about accessing and using wide-ranging demographic-economic data and data analytics. Learn more about using these data for areas and applications of interest.

About the Author
— Warren Glimpse is former senior Census Bureau statistician responsible for innovative data access and use operations. He is also the former associate director of the U.S. Office of Federal Statistical Policy and Standards for data access and use. He has more than 20 years of experience in the private sector developing data resources and tools for integration and analysis of geographic, demographic, economic and business data. Contact Warren. Join Warren on LinkedIn.


Census 2020 P.L. 94-171 Redistricting Data Updates

.. we are just two years away from the first census block level data from Census 2020.  The initial block level data will be the P.L. 94-171 redistricting data.  But before that, the initial Census 2020 TIGER/Line shapefiles/GIS files, the geography, will become available in November 2020, maybe earlier.  Stakeholders will be able to see how block and tract codes and geography have changed in many areas since 2010.  The prototype P.L. 94-171 data (see final file layout and subject matter items) are expected in the last week of March 2019 and will cover the Providence County, RI area. This post shows illustrative views and related details about the area. The Census 2020 P.L. 94-171 program and plans are reviewed in this Federal Register notice.

The applications/views shown below have been developed using the ProximityOne CV XE GIS software and related GIS project.

Census 2020 Data Access and Use Program
ProximityOne operates a comprehensive Census 2020 Data Access and Use Program providing tools to integrate and analyze these data with other data for redistricting, planning, evaluation, management, general analysis and policy-related applications. Contact us for more information; mention Census 2020 Data Access and Use Program in text section.

Providence, RI Census 2020 P.L. 94-171 Prototype
The Census 2020 P.L. 94-171 prototype covers Providence County, RI, part of the Providence-Warwick, RI-MA MSA (39300) — see Situation& Outlook report. Providence County is shown with cross-hatch pattern in the following graphic.

The next graphic shows a zoom-in to the county with cities/places shown with green fill pattern.

The next graphic shows patterns of economic prosperity for the county based on ACS 2017 median household income by census tract — blue, higher and red, lower.

The next graphic shows Census 2010 blocks for the county. Demographics described in the P.L. 94-171 file described about will be provided at the census block level.

Census block boundaries are primarily defined by roads. Providence County roads are shown in the next view.

The next view shows a zoom-in to the downtown Providence city area. Census blocks are shown with red boundaries and labeled with the 15-character U.S. national scope unique census block code. The pointer is located in census block 440070012001001, or 44-007-001200-1001, expressed as SS-CCC_TTTTTT-BBBB. Access these Census 2010 data (an example) using the Census FactFinder tool via this link. This is the “P1 RACE” table. The Census 2010 population of the block was 598. This census block is one of 13,597 Census 2010 census blocks comprising Providence County.

Rhode Island 116th Congressional Districts 01 and 02 (labeled) split Providence city (cross-hatch pattern) as shown in the graphic below. Pointer shows CD boundary.

Similar to above, the graphic below shows census blocks in context of Providence city (bold green boundary) and CDs 01 and 02.

Next Steps
This section provides a geographic orientation the Census 2020 P.L. 94-171 prototype area. A subsequent post (March 2019) will extend on this post with Census 2020 P.L. 94-171 data and related details. Use the downloadable project and software to examine geodemographics and redistricting operations.

Data Analytics Web Sessions
See these applications live/demoed. Run the applications on your own computer.
Join me in a Data Analytics Lab session to discuss more details about accessing and using wide-ranging demographic-economic data and data analytics. Learn more about using these data for areas and applications of interest.

About the Author
— Warren Glimpse is former senior Census Bureau statistician responsible for innovative data access and use operations. He is also the former associate director of the U.S. Office of Federal Statistical Policy and Standards for data access and use. He has more than 20 years of experience in the private sector developing data resources and tools for integration and analysis of geographic, demographic, economic and business data. Contact Warren. Join Warren on LinkedIn.


Redistricting & Census 2020

.. most states will not have new redistricting plans until after Census 2020. Redistricting is the process of developing a redistricting plan for 2 or more areas (districts) disjoint and contiguous that are contained within the collective area of all districts based on some criteria. Redistricting is perhaps most familiar with regard to congressional districts and state legislative districts based on a set of demographic characteristics … but may apply to many other types of geographies. This post briefly reviews the Census 2020 & Redistricting Program.

Redrawing the Pennsylvania 115th Congressional Districts
The following views show Pennsylvania 115th Congressional Districts in their gerrymandered configuration (old) and the redrawn configuration (February 2018, new). Counties shown with light gray boundary. Click graphic for larger view. Expand browser window for best quality view.
Pennsylvania 115th CDs — Old

– View developed using CV XE GIS and related GIS project.

Pennsylvania 115th CDs — New, redrawn February 2018

– View developed using CV XE GIS and related GIS project.

Census 2020 & Redistricting Program
The ProximityOne Census 2020 & Redistricting Program enables participants to engage now in preparation for redistricting based on Census 2020. Use resources and processes provided by ProximityOne and the Congressional Districts/State Legislative Districts Group (CDSLD) .. participate in hands-on redistricting for your areas of interest. We start now using Census 2010 redistricting data, current congressional districts and state legislative districts, and related data/tools. Progressively, we move toward accessing the live Census 2020 redistricting data (March 2021). There is no cost to participate. See more about the Census 2020 & Redistricting Program at http://proximityone.com/cen2020_redistricting.htm. Join the CDSLD Group via this form to receive updates on the program and begin participation.

Data Analytics Web Sessions
Join me in a Data Analytics Web Session, every Tuesday, where we review access to and use of data, tools and methods relating to the Census 2020 redistricting Program. We review current topical issues and data — and how you can access/use tools/data to meet your needs/interests.

About the Author
Warren Glimpse is former senior Census Bureau statistician responsible for innovative data access and use operations. He is also the former associate director of the U.S. Office of Federal Statistical Policy and Standards for data access and use. He has more than 20 years of experience in the private sector developing data resources and tools for integration and analysis of geographic, demographic, economic and business data. Contact Warren. Join Warren on LinkedIn.

Federal Statistical System Updates January 2018

.. sharing updates on developments about and within the Federal Statistical System (http://proximityone.com/fss.htm). Today I attended a briefing by Nancy Potok, U.S. Chief Statistician (part of OMB OIRA) at the American Statistical Association offices. The session was coordinated by the Council of Professional Associations on Federal Statistics (COPAFS).

Several topics were discussed, including:

1. Will the Federal government shutdown on January 19, 2018, due to a budget impasse? As of now, there seems to be a 50-50 consensus likelihood.

2. In the spring of 2018, there might be a far-reaching Federal government reorganization plan released by OMB. While there are no details on this, it may well be that certain Federal statistical agencies will be reorganized. This follows more than a year of processing recommendations suggested by individual agencies. Right now, it is not clear if this will be focused on Federal statistical and information-related operations or something broader.

3. It is expected that the 2018 Federal budget, thus including the 13 primary Federal statistical agencies, will be released in early February. Much of the 2019 Federal budget is also completed, though many important details remain.

4. The widely publicized possible addition of a citizenship question to 2020 census questionnaire was discussed. OMB approves the addition or deletion of all questions on Federal government information collection forms. See USATODAY editorial comments today, consistent with my opinion. The merit to the argument to add the citizenship question, if there is one, is that while block group level tabulations of citizenship status from the American Community Survey are available and updated annually, these are subject to sampling error and other errors of estimation, they are not tabulated at the census block level, they are estimates for respondents over a five year period, and they will lag the 2020 census data (first release March 31, 2021) with ACS 2018 estimates (centric to mid-2016) released in December 2020. Key facts are that 1) at there is no Federal government agency requirement for citizenship by block data, 2) a citizenship question definitely imperil the quality of the Census 2020 results, 3) block group level data are sufficient for any reasonable need, 4) the cost of adding the question would be huge in an already underfunded census.

Next Federal Statistical System Updates
The next planned Federal Statistical System update will be in March followed by an update in April. We might move to a recurring monthly update.

Data Analytics Web Sessions
Join me in a Data Analytics Lab session to discuss more details about accessing and using wide-ranging demographic-economic data and data analytics. Learn more about using these data for areas and applications of interest.

About the Author
— Warren Glimpse is former senior Census Bureau statistician responsible for innovative data access and use operations. He is also the former associate director of the U.S. Office of Federal Statistical Policy and Standards for data access and use. He has more than 20 years of experience in the private sector developing data resources and tools for integration and analysis of geographic, demographic, economic and business data. Contact Warren. Join Warren on LinkedIn.

Census 2020 LUCA Program and You

.. what would be the financial impact of a one-percent understatement in the Census 2020 population count? Many political districts are drawn based upon population change and shifts, and allocations of government funding and services are made based upon official population data. Consider this one specific example. For each one-percent of the Atlanta MSA population missed in Census 2020, potentially due to less than fully accurate address and location data, the financial impact could be on the order of $414 million per year. How and why? At margin, each person not counted in the decennial census results in a per capita disposable income loss for the area in the magnitude of $5,494 in 2000, and $6,770 per person in 2020. 61,100 people undercounted times $6,770 yields $414 million.

This section is about the Censue 2020 Local Update of Census Addresses (LUCA) program and how it might impact the reduction in undercount .. and make the data more accurate for wide-ranging needs and uses. Read on for details about the LUCA program.

Atlanta-Sandy Springs-Roswell, GA MSA
The Atlanta metro shown with black bold boundary. More about this metro.

– View developed with CV XE GIS software.
– Click graphic to view patterns of neighborhood economic prosperity.

Financial Impact Details … the 2015 per capita current transfer payments (PCTP) in the Atlanta-Sandy Springs-Marietta MSA were $6,132, up from $5,494 in 2010. The PCTP figure in 2020 may be $6,770. For each one-percent of the Atlanta MSA population (61,100 people) missed in Census 2020, potentially due to less than fully accurate address and location data, the financial impact could be in the order of $414 million (61,100 x $6,770) per year as of Census 2020.  $414 million per year based on the 2020 population and PCTP.

Financial Impact in Your Areas of Interest
Estimate the financial impact in your areas of interest. Get the 2010 and 2015 population and PCTP data from the REIS Interactive Table for any county or state.  Compute the 2020 population and PCTP values, potential undercount to determine the financial impact on an area of interest

Census 2020 LUCA Overview
The Census 2020 LUCA program is an initiative of the Census Bureau, partnering with thousands of state and local governments across the U.S. At the core of this program, Census provides address list data to communities; those communities compare those data with their own data and provide address/geographic updates back to the Census Bureau.  The updated address and geographic data are integrated into the TIGER/Line files  — geographic backbone for collecting and tabulating the Census results. This important MAF/TIGER address-plus update program will help insure improved accuracy for Census 2020. LUCA is a geographic data development program engaging local communities across the U.S.

ProximityOne works with local areas to improve the TIGER/Line files leading up to Census 2020. Using the CV XE GIS software and specialized expertise, we helped hundreds of governmental units, including all of the State of Georgia, improve the coverage and content of the TIGER/Line files and thus the accuracy and completeness of Census 2010.

The Census 2020 LUCA program is starting now in 2016.  See the full schedule and related details in the LUCA Web section.

Join me in a Data Analytics Lab session to discuss more details about accessing and using wide-ranging demographic-economic data and data analytics. Learn more about using these data for areas and applications of interest.

About the Author
— Warren Glimpse is former senior Census Bureau statistician responsible for innovative data access and use operations. He is also the former associate director of the U.S. Office of Federal Statistical Policy and Standards for data access and use. He has more than 20 years of experience in the private sector developing data resources and tools for integration and analysis of geographic, demographic, economic and business data. Contact Warren. Join Warren on LinkedIn.