Tag Archives: Hispanic Population by Specific Origin

Hispanic Population by Specific Origin by ZIP Code

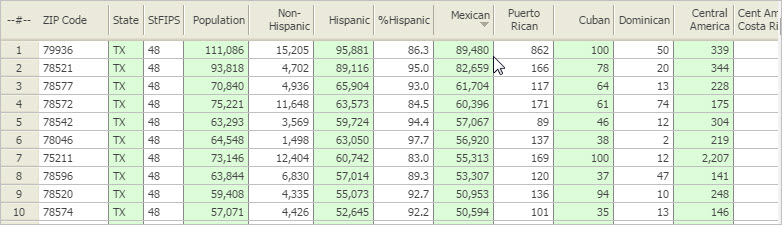
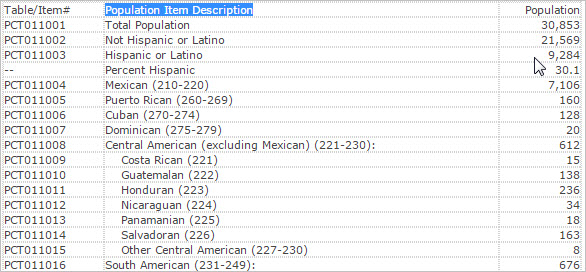
.. the U.S. Hispanic population increased by 24-percent from 2010 to 2021. This change reflects net Hispanic immigration plus Hispanic population who are otherwise residents. The following graphic shows how the U.S. national scope Hispanic population by specific origin changed from 2010 to 2021. Use this interactive table to learn about Hispanic population by specific origin by ZIP code. Click graphic for larger view.

How the Hispanic Population by Specific Origin is Changing

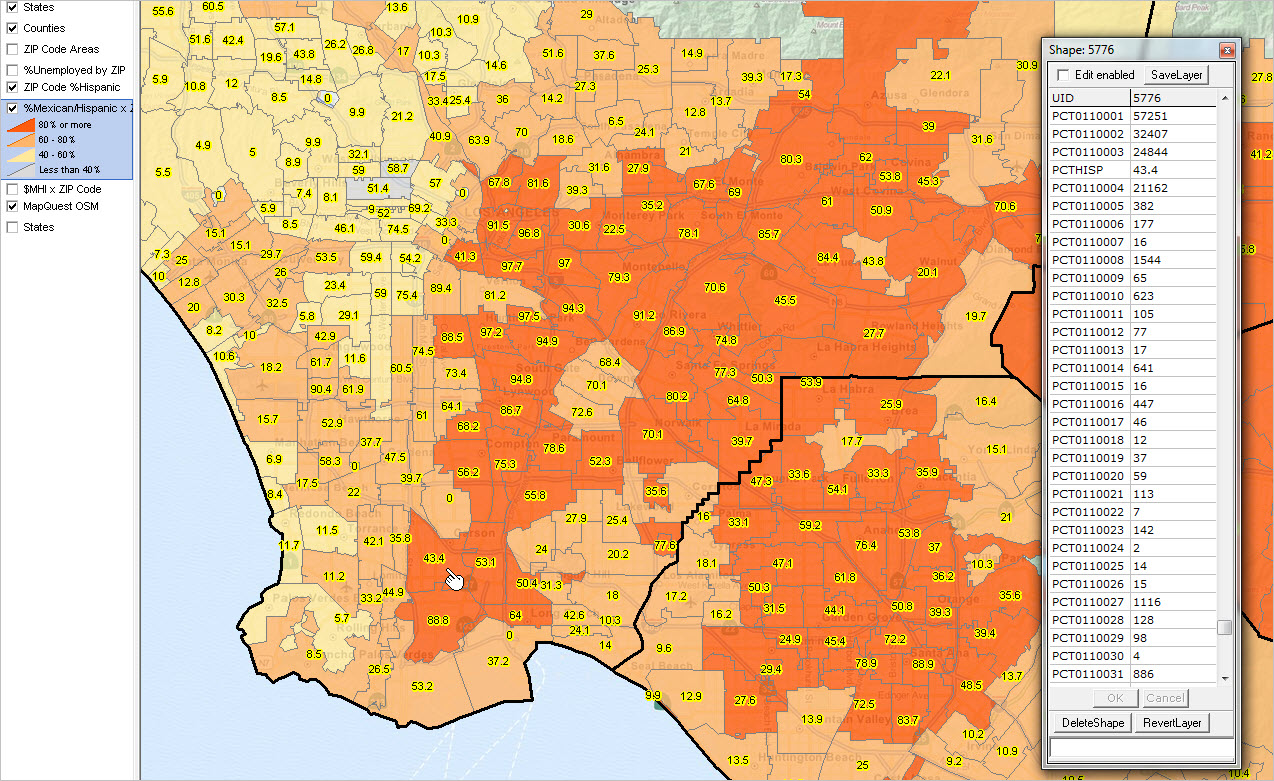
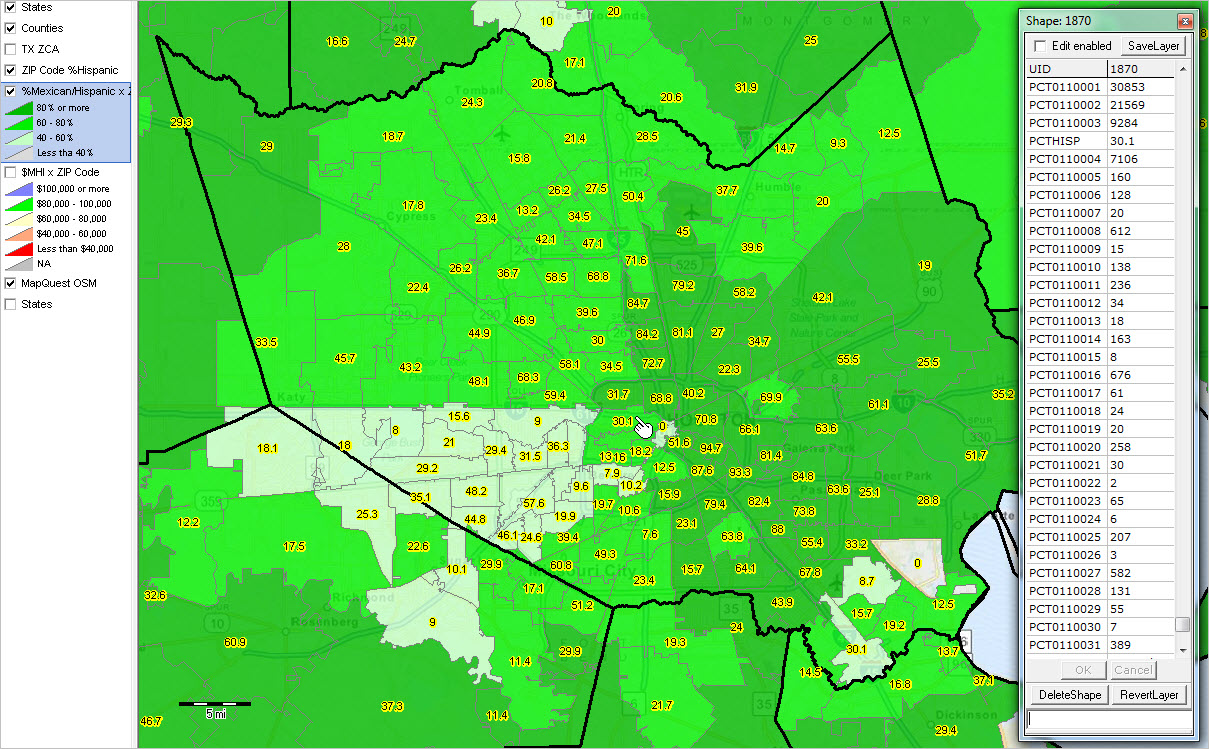
Examining Patterns of Percent Mexican Population by ZIP Code
The graphic below shows ZIP code areas with ZIP code as upper label and percent Mexican population as lower label in context of Fresno city, CA (orange cross-hatch pattern). VDA Desktop GIS users may create this view (or variations) for any area using the Mapping Statistical Data GIS project.

More About Hispanic Population
The U.S. Office of Management and Budget (OMB) defines “Hispanic or Latino” as a person of Mexican, Cuban, Puerto Rican, South or Central American, or other Spanish culture or origin regardless of race. People who identify with the terms “Hispanic” or “Latino” are those who classify themselves in one of the specific Hispanic or Latino categories listed on the decennial census of ACS questionnaire. Data tabulations. estimates, of the Hispanic population are “of any race” unless otherwise stated. See the section Hispanic Population by Specific Origin for more information.

About VDA GIS
Use VDA GIS tools to meet wide-ranging mapping needs and geospatial analysis. VDA Desktop GIS and VDA Web GIS have similar features that can be used separately or together. Each is a decision-making information resource designed to help stakeholders create and apply insight. VDA Web GIS is access/used with only a Web browser; nothing to install; GIS experience not required. VDA Desktop GIS is installed on a Windows computer and provides a broader range of capabilities compared to VDA Web GIS. VDA GIS resources have been developed and are maintained by Warren Glimpse, ProximityOne (Alexandria, VA) and Takashi Hamilton, Tsukasa Consulting (Osaka, Japan).

Data Analytics Web Sessions
Join us in the every Tuesday, Thursday Data Analytics Web Sessions. See how you can use VDA Web GIS and access different subject matter for related geography. Get your geographic, demographic, data access & use questions answered. Discuss applications with others.

About the Author
Warren Glimpse is former senior Census Bureau statistician responsible for national scope statistical programs and innovative data access and use operations. He is also the former associate director of the U.S. Office of Federal Statistical Policy and Standards for data access and use. He has more than 20 years of experience in the private sector developing data resources and tools for integration and analysis of geographic, demographic, economic and business data. Join Warren on LinkedIn.

Hispanic Population by Specific Origin by ZIP Code

.. the Hispanic population is diverse … here we share information about data and tools that can be used to examine the Hispanic population by specific origin by ZIP code. The Hispanic or Latino population group is comprised of many specific origin subgroups. The specific origin subgroups are often associated with different regions of the world. Many specific origin subgroups tend to cluster by location within the U.S. both as a result of the geography of emigration (e.g., Mexico to Texas) and association with where same subgroup emigrants have settled (e.g., Cuba to New York). This section provides insights into how the Hispanic specific origin subgroups are distributed across the U.S. by ZIP Code Area. Tools are provided to analyze geographic and subgroup patterns of interest. For more details and to access interactive table see related Web section.

Mexican Population as Percent of Total Hispanic Population
— Los Angeles metro area by ZIP Code

Click for larger view.
Labels show Hispanic population as a percent of total population.
Color patterns show Mexican population as percent of Hispanic population.
View created using CV XE GIS.

Census 2010 identifies approximately 70 Hispanic specific origin subgroups (see list). The table presented below shows the U.S. Census 2010 Hispanic population for a summary of these specific origin subgroups organized into 28 more aggregated groups. The Census 2010 population by ZIP Code for these same 28 subgroups is presented in an interactive table below in this section.

See related sections:
Hispanic Population by Specific Origin by County
ZIP Code Geographic, Demographic, Economic Data Resources

Hispanic Population by Specific Origin: Census 2010
This graphic below is a partial view of a table showing Census 2010 Hispanic population by specific origin. See full table in related Web section.

Visual Pattern Analysis with GIS Tools — scroll section
The following graphic shows the Mexican population as a percent of total Hispanic population by ZIP Code area in the Houston, Texas/Harris County (bold black boundary) area. See color/interval patterns in legend at left of map. ZIP codes are labeled with Hispanic population as a percent of total population.

Click for larger view; larger view shows mini-profile of ZIP Code 77077.
View created using CV XE GIS.

Interactive Table
— Hispanic Population by Specific Origin by ZIP Code Area

View, rank, compare, query patterns of the Hispanic population by specific origin by ZIP code area using the interactive table. The following graphic shows a view of the interactive table illustrating Texas ZIP codes sorted in descending order on the Mexican population column.

Click graphic for larger view.

Scope of Specific Origin Data in Interactive Table
The following graphic shows a partial view of the Hispanic specific origin population items that are included in the interactive table. This example shows data for the Houston area ZIP code 77077. See the complete list of items in the related Web section.

Click graphic for larger view.

Link these Census 2010 demographics for ZIP code areas with American Community Survey demographics to view/analyze a broader array of demographic-economic subject matter. See ZIP Code Geographic, Demographic, Economic Data Resources.

About the Author
— Warren Glimpse is former senior Census Bureau statistician responsible for innovative data access and use operations. He is also the former associate director of the U.S. Office of Federal Statistical Policy and Standards for data access and use. He has more than 20 years of experience in the private sector developing data resources and tools for integration and analysis of geographic, demographic, economic and business data.