
.. GIS tools & data resources that you can use for statistical mapping & visual data analysis … Geographic Information Systems (GIS) provide flexible and powerful capabilities to combine maps with data. In our increasingly data rich environment, we often experience “drowning in data.” GIS tools can help harness disparate and voluminous data and assist with data linkage. This section provides links to other sections that provide information on no cost GIS software and “production” GIS projects and datasets that you can use.
Patterns of Per Capita Personal Income Change 2008-14 by County
— relative to U.S. PCPI 2008-14 change
To illustrate, the following graphic shows patterns of per capita personal income change 2008 to 2014 by county relative to the U.S. See more information. Click graphic for larger view with legend and additional details. Make variations of this map view using resources described in this section. Optionally integrate your own data.
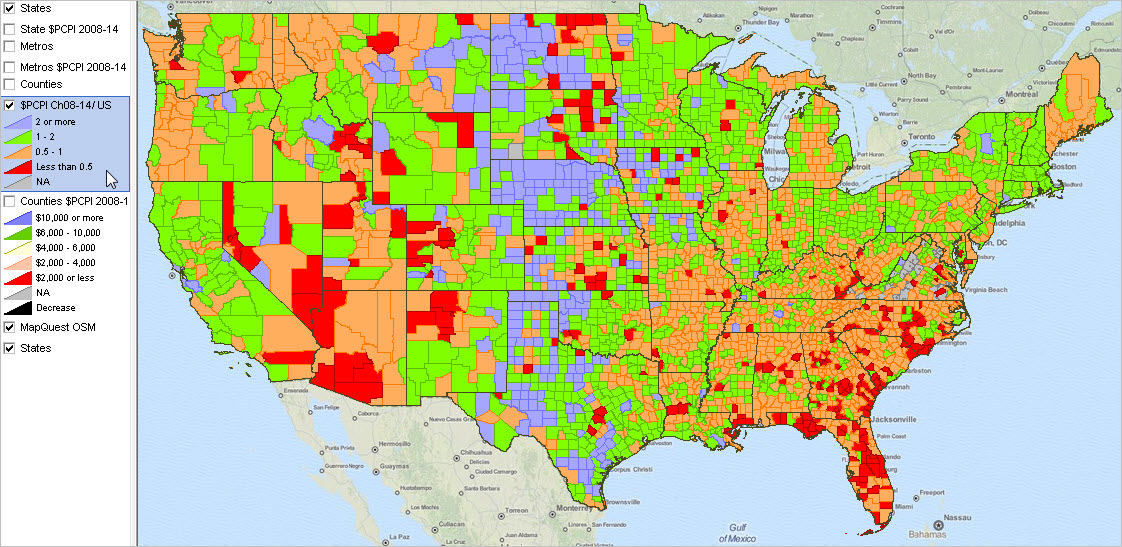
— view created using CV XE GIS and associated REIS GIS Project
GIS provides us with a way to improve collaboration; we can more easily comprehend and understand geographic relationships and patterns among “variables” and statistical data. As we reduce tabular data to visual representations, we are better able to communicate “what the data are telling us” among stakeholders and teams/committees. This second dimension, learning what the data are telling us, provides the power of creating insights for more effective decision-making.
Mapping Statistical Data Topics
Most applications presented in this section involve use of Windows-based desktop GIS software. The software and GIS project files and datasets are installed on your computer. These resources are available for use by members of the User Group at no fee. Click a link below to view additional details about a topic of interest. There you find a description of the scope and use of the data/geography, steps to access and use the GIS projects/datasets and getting started tutorials.
• World by Country
• U.S. by State
• U.S. by Congressional District
• U.S. by Metropolitan Area
• U.S. by County
• U.S. by City/Place
• U.S. by ZIP Code Area
• State by Census Tract (each/all states)
• State by Block Group
• State by Census Block
• K-12 Schools & School District Data Analytics
Applications make use of a range of statistical data from the Federal Statistical System, and other sources, integrated with shapefiles from the Census Bureau TIGER/Line shapefiles, OpenStreetMaps, and other sources.
Join me in a Data Analytics Lab session to discuss accessing, integrating and using these resources … and linking these data/geography with other data that relate to your situation.
About the Author
— Warren Glimpse is former senior Census Bureau statistician responsible for innovative data access and use operations. He is also the former associate director of the U.S. Office of Federal Statistical Policy and Standards for data access and use. He has more than 20 years of experience in the private sector developing data resources and tools for integration and analysis of geographic, demographic, economic and business data. Contact Warren. Join Warren on LinkedIn.
