
… examining Minneapolis-St. Paul-Bloomington, MN-WI metropolitan area:
• How will the market for single family homes change over the next 5 years?
• How does economic prosperity in this metro compare to others?
• What are the patterns in metro rental income and rental vacancy rates?
• How do patterns vary within the metro by county/neighborhood?
• How are demographic-economic characteristics trending?
We examine these types of topics in this section. Stakeholders can replicate applications reviewed here for this and other metros. Select any metro.
Metropolitan areas include approximately 94 percent of the U.S. population — 85 percent in metropolitan statistical areas (MSAs) and 9 percent in micropolitan statistical areas (MISAs). Of 3,143 counties in the United States, 1,167 are in the 381 MSAs in the U.S. and 641 counties are in the 536 MISAs (1,335 counties are in non-metro areas).
Focus on Minneapolis-St. Paul-Bloomington, MN-WI MSA
This section is focused on the Minneapolis-St. Paul-Bloomington, MN-WI MSA; Core-Based Statistical Area (CBSA) 33460. It is not intended to be a study of the metro but rather illustrate how relevant decision-making information resources can be brought together to examine patterns and change and develop insights. The data, tools and methods can be applied to any metro.
– See a more detailed version of this document focused on this metro.
The Minneapolis-St. Paul-Bloomington, MN-WI MSA is shown in the graphic below. The 20-county metropolitan statistical area is shown with bold boundary; counties appear with black boundaries and county name/geographic code labels.
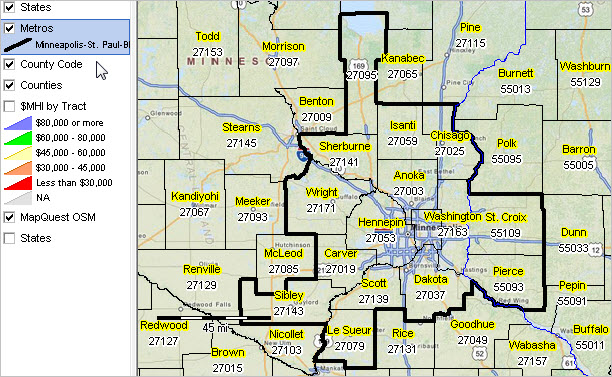
Click graphic for larger view. Map developed using CV XE GIS.
This metro is home to Fortune 1000 companies including 3M Company, Ameriprise Financial, Best Buy Co., General Mills, Inc., Land O’Lakes, Inc. and many others.
Metro principal cities (about principal cities) … click the link to view city profile Bloomington .. Eagan .. Eden Prairie .. Minneapolis .. Plymouth .. St. Paul
The total population of the Minneapolis-St. Paul-Bloomington, MN-WI metro changed from 3,355,105 in 2010 to 3,495,176 in 2014, a change of 140,071 (4.17%). Among all 917 metros, this metro was ranked number 16 in 2010 and 16 in 2014, based on total population. Annual net migration was 10,659 (2011), 10,100 (2012), 13,897 (2013), 10,762 (2014). View annual population estimates and components of change table. See more about population characteristics below.
This metro is projected to have a total population in 2020 of 3,698,877. The projected population change from 2010 to 2020 is 343,772 (10.2%). The population ages 65 years and over is projected to change from 372,335 (2010) to 603,936 (2020), a change of 231,601 (62.2%). See more about population projections.
Based on per capita personal income (PCPI), this metro was ranked number 37 in 2008 and 44 in 2014. The PCPI changed from $47,956 in 2008 to $53,166 in 2014, a change of $5,210 (10.9%). Per capita personal income (PCPI) is a comprehensive measure of individual economic well-being. Use the interactive table to compare PCPI in this metro to other metros.
The following thematic pattern shows a measure of economic prosperity (median household income: MHI) by census tract.
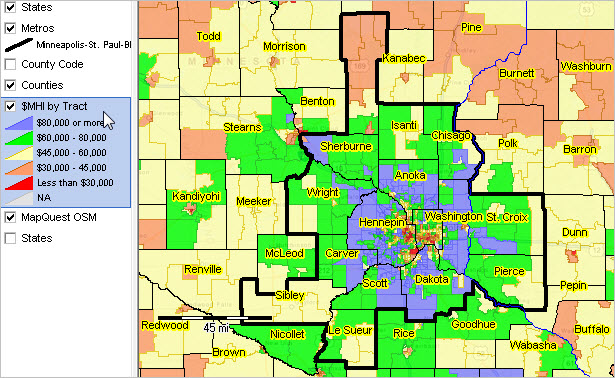
Click graphic for larger view. Map developed using CV XE GIS.
Develop variations of this map view using the Mapping Minnesota Neighborhood Patterns GIS resources.
View additional selected details about the metro …
– Component City Characteristics
– Component County Characteristics
– Economic Profile
– Component School District Characteristics
Join me in a Data Analytics Lab session to discuss more details about this metro, comparing this metro to peer group metros and use of data analytics to develop further detail related to your situation.
About the Author
— Warren Glimpse is former senior Census Bureau statistician responsible for innovative data access and use operations. He is also the former associate director of the U.S. Office of Federal Statistical Policy and Standards for data access and use. He has more than 20 years of experience in the private sector developing data resources and tools for integration and analysis of geographic, demographic, economic and business data. Contact Warren. Join Warren on LinkedIn.
