Category Archives: school districts by type

Financing America’s Schools

.. as we look to restarting America’s economy, the nation’s public school systems face many questions and logistical issues.  Among these issues are a wide range of financial challenges.  Financing America’s public K-12 schools is supported by a mix of Federal, state and local funding.  In FY 2017, 13,311 regular public school districts reported total revenues of $679,925 billion derived from $51,212 billion federal (7.5%), $317,434 billion state (46.7%) and $311,278 billion local (45.8%) sources. These data are based on the school district finances (F-33) program data released by the Census Bureau in May 2019. States and individual school districts vary widely on the make-up/distribution of these federal, state and local sources.  See more about this topic and related K-12 schools topics in the ProximityOne K-12 schools main Web section.

Use tools and data reviewed here to examine K-12 school district finances — sources and uses of funds for FY 2017. View, sort, query, compare school district sources and uses of funds using the interactive table below in this section. Create/view profiles for district(s) of interest.

Data and resources reviewed here update in early May 2020 with new FY 2018 sources and uses of funds data and related school/school district financial data. We examine the implications of COVID-19 for school systems as we look to Restarting the EconomyJoin the User Group to receive updates.

Percent Federal Revenue by School District, FY 2017
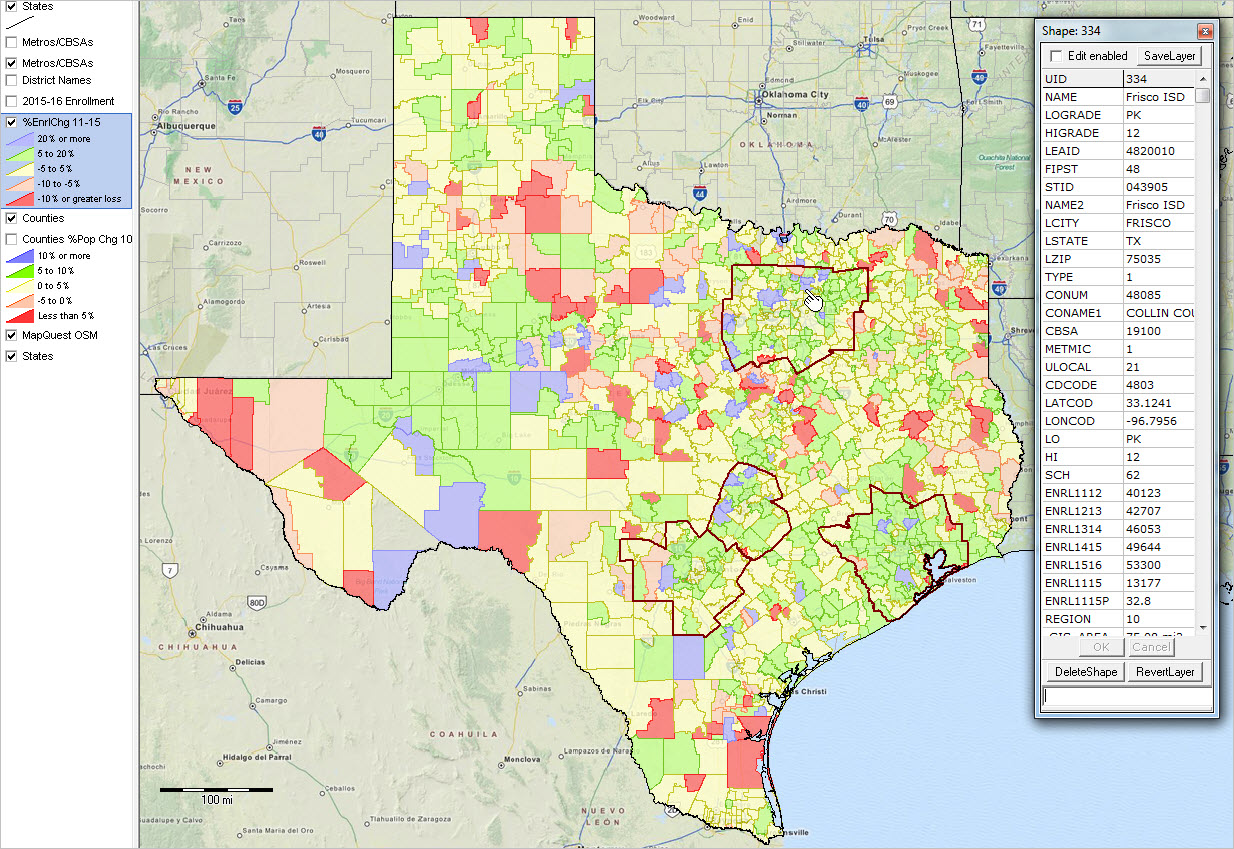
The following graphic shows patterns of percent Federal revenue by school district (unified and secondary), FY 2017. Click graphic for larger view. Expand browser to full window for best quality view.

– view developed using ProximityOne CV XE GIS software and related GIS project.
– use these tools on your computer to examine these data & related data.

Percent State Revenue by School District, FY 2017
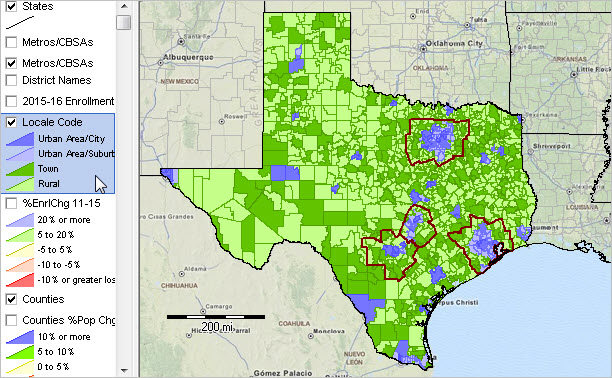
The following graphic shows patterns of percent State revenue by school district (unified and secondary), FY 2017. Click graphic for larger view. Expand browser to full window for best quality view.

– view developed using ProximityOne CV XE GIS software and related GIS project.
– use these tools on your computer to examine these data & related data.

Interactive Table
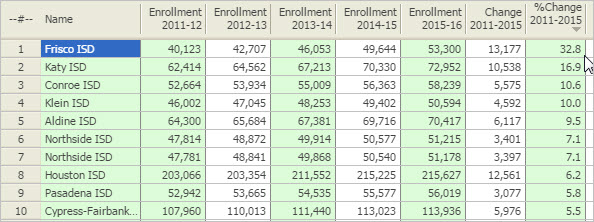
The following static graphic shows the 10 Texas school districts having the largest Federal revenue. Sources of Federal revenue by program are also shown. Create views like this for any of the sources and uses of funds items for your selection of school districts. Use the interactive table (separate page) for dynamic analysis of individual school districts in context of U.S. overall, states or metros. Select by state or metro and rank based on any of several selected revenue by source and per student expenditure by category.


– click graphic for larger view

Situation & Outlook Web Sessions
Join me in a Situation & Outlook Web Session where we discuss topics relating to measuring and interpreting the where, what, when, how and how much demographic-economic change is occurring and it’s impact.

About the Author
— Warren Glimpse is former senior Census Bureau statistician responsible for innovative data access and use operations. He is also the former associate director of the U.S. Office of Federal Statistical Policy and Standards for data access and use. He has more than 20 years of experience in the private sector developing data resources and tools for integration and analysis of geographic, demographic, economic and business data. Contact Warren. Join Warren on LinkedIn.

Texas School District Demographic Trends

.. new data, new insights .. in the 2015-16 school year, there were 21 school districts in Texas (of a total 1,025) with enrollment of 50,000 or more students. Among these districts, six districts experienced an enrollment decline between the 2011-12 and 2015-16 school years. Four districts experienced more than 10-percent increase in enrollment (Frisco, Katy, Conroe and Klein). Use the interactive table to view, rank, query and compare Texas school districts by annual enrollment, 2011-12 to 2015-16 , and change over the period. This section provides access to data analytics tools to examine patterns and characteristics of enrollment for Texas local education agencies. Use the GIS project and datasets described here to examine districts and regions of interest. See the full Web page for more comprehensive version of topics reviewed here.

Enrollment Change Patterns: Texas School Districts. 2011-2015
The following graphic shows patterns of the percent enrollment change by Texas school district during the period 2011-12 to 2015-16 school year. The percent change intervals/colors as depicted in legend panel at left of map window. Create custom maps similar to this view for your regions of interest. Examine alternative patterns such as percent change for different time periods, enrollment change or enrollment level. Set queries to include school district by peer group. Click graphic for larger view with more detail; expand browser window for best quality view.

View developed with CV XE GIS software using the Texas school districts GIS project.

The following views (click link) show a zoom-in with districts labeled with name and 2015-16 enrollment .. install the software and GIS project on your Windows computer for alternative and more detailed views.
Dallas Metro Region
Houston Metro Region
San Antonio-Austin Metro Region

School Districts by Locale Code
The following view shows patterns of school districts by locale code. Examine districts based locale code in the interactive table below. See more about locale code below in this section.

View developed with CV XE GIS software using the Texas school districts project.

Additional School District Demographic-Economic Data
Use the following interactive tables to view attributes of individual school districts in context of others. These are national scope tables; select only Texas (or other state) using tools below table on respective pages. Compare Texas (or other state) school districts by national scope peer group size.
General Demographics
Social Characteristics
Economic Characteristics
Housing Characteristics
More about data analytics and analyzing the school district community.

Enrollment by Texas Local Education Agency: 2011-12 – 2015-16
— Interactive Table
The following graphic illustrates use of the interactive table. This view shows districts having 2015-16 enrollment 50,000 or more ranked in descending order on the enrollment percent change from the 2011-12 school year to the 2015-16 school year. See the full interactive table to perform similar operations. Click graphic for larger view.

See about other demographic-economic interactive tables.

Join me in a Data Analytics Lab session to discuss more details about accessing and using wide-ranging demographic-economic data and data analytics. Learn more about using these data for areas and applications of interest.

About the Author
— Warren Glimpse is former senior Census Bureau statistician responsible for innovative data access and use operations. He is also the former associate director of the U.S. Office of Federal Statistical Policy and Standards for data access and use. He has more than 20 years of experience in the private sector developing data resources and tools for integration and analysis of geographic, demographic, economic and business data. Contact Warren. Join Warren on LinkedIn.

Local Education Agencies by Type & State

.. the number and structure of school districts by state varies widely. Does this have an impact on educational outcomes and opportunities from state to state? In 1952, Texas had approximately 2,500 school districts (see in related section; today there are 1,027 school districts in Texas (see full table). School districts are now part of a more broadly structured set of Local Education Agencies (LEAs) which include state, regional and independent charter agencies offering elementary/secondary education. This section provides data on the count and type of LEAs by state for the 2014-15 school year.

Use the interactive table to view, rank, compare school districts/LEAs by state by type for the 2014-15 school year. These summary data are based on our processing of individual LEA data provided by individual state education agencies. Additional detail by LEA will be available later in 2016.

2014-15 LEAs by State
States labeled with total LEAs as of the 2014-15 school year. Click graphic for larger, more detailed view. Expand browser window for best quality view.

.. view developed with ProximityOne CV XE GIS and related GIS project.

2014-15 Independent Charter Agencies by State
States labeled with Independent Charter Agency (ICA) LEAs as of the 2014-15 school year (3,056). States with no ICAs not labeled. Red markers show locations of all ICAs. Click graphic for larger, more detailed view. Expand browser window for best quality view.

.. view developed with ProximityOne CV XE GIS and related GIS project.

Additional views – click to view graphic; expand browser window for best quality view:
Houston area zoom-in showing ICAs with name as label
Houston area zoom-in showing charter schools (green markers)
– black boundary shows Houston ISD school district
– yellow label: total enrollment; white label: total free & reduced lunch fee

Kansas City area zoom-in showing ICAs with name as label
– black boundary shows Kansas City, MO school district
Kansas City area zoom-in showing charter schools (green markers)
– black boundary shows Kansas City, MO school district
– yellow label: total enrollment; white label: total free & reduced lunch fee

Related School District Data
See about related demographic-economic datasets, interactive tables & GIS resources: General Demographics .. Social Characteristics .. Economic Characteristics .. Housing Characteristics

States Ranked by Total LEAs
The following graphic shows states ranked by total LEAs using the interactive table — the 10 states having the largest number of LEAs. Click graphic for larger view.

Join me in a Data Analytics Lab session to discuss more details about analyzing LEA characteristics and pattern and use of data analytics to develop further detail related to your interests.

About the Author
— Warren Glimpse is former senior Census Bureau statistician responsible for innovative data access and use operations. He is also the former associate director of the U.S. Office of Federal Statistical Policy and Standards for data access and use. He has more than 20 years of experience in the private sector developing data resources and tools for integration and analysis of geographic, demographic, economic and business data. Contact Warren. Join Warren on LinkedIn.