
.. new data, new insights .. in the 2015-16 school year, there were 21 school districts in Texas (of a total 1,025) with enrollment of 50,000 or more students. Among these districts, six districts experienced an enrollment decline between the 2011-12 and 2015-16 school years. Four districts experienced more than 10-percent increase in enrollment (Frisco, Katy, Conroe and Klein). Use the interactive table to view, rank, query and compare Texas school districts by annual enrollment, 2011-12 to 2015-16 , and change over the period. This section provides access to data analytics tools to examine patterns and characteristics of enrollment for Texas local education agencies. Use the GIS project and datasets described here to examine districts and regions of interest. See the full Web page for more comprehensive version of topics reviewed here.
Enrollment Change Patterns: Texas School Districts. 2011-2015
The following graphic shows patterns of the percent enrollment change by Texas school district during the period 2011-12 to 2015-16 school year. The percent change intervals/colors as depicted in legend panel at left of map window. Create custom maps similar to this view for your regions of interest. Examine alternative patterns such as percent change for different time periods, enrollment change or enrollment level. Set queries to include school district by peer group. Click graphic for larger view with more detail; expand browser window for best quality view.
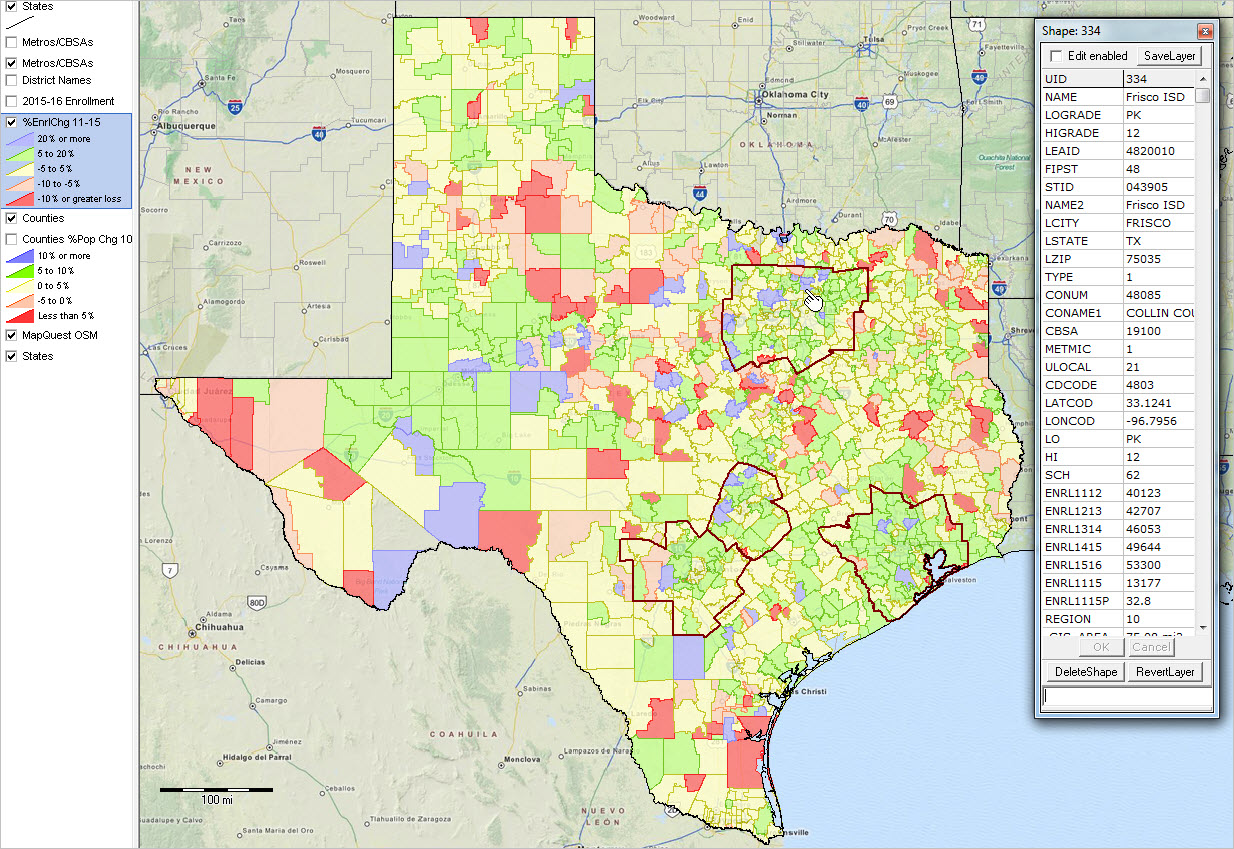
View developed with CV XE GIS software using the Texas school districts GIS project.
The following views (click link) show a zoom-in with districts labeled with name and 2015-16 enrollment .. install the software and GIS project on your Windows computer for alternative and more detailed views.
• Dallas Metro Region
• Houston Metro Region
• San Antonio-Austin Metro Region
School Districts by Locale Code
The following view shows patterns of school districts by locale code. Examine districts based locale code in the interactive table below. See more about locale code below in this section.
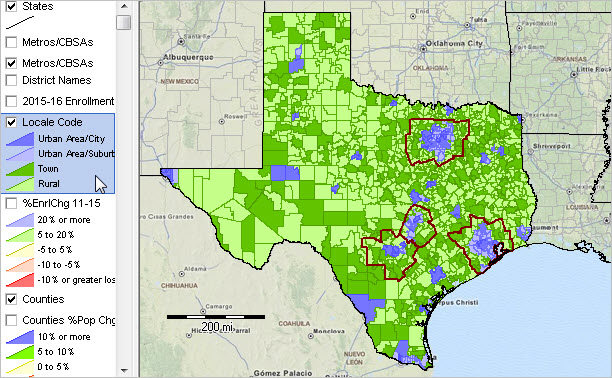
View developed with CV XE GIS software using the Texas school districts project.
Additional School District Demographic-Economic Data
Use the following interactive tables to view attributes of individual school districts in context of others. These are national scope tables; select only Texas (or other state) using tools below table on respective pages. Compare Texas (or other state) school districts by national scope peer group size.
• General Demographics
• Social Characteristics
• Economic Characteristics
• Housing Characteristics
More about data analytics and analyzing the school district community.
Enrollment by Texas Local Education Agency: 2011-12 – 2015-16
— Interactive Table
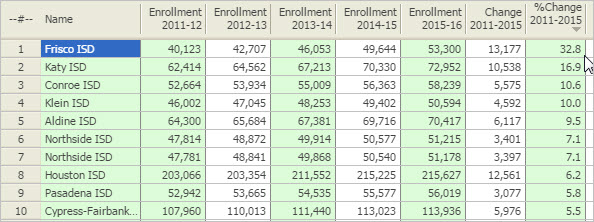
The following graphic illustrates use of the interactive table. This view shows districts having 2015-16 enrollment 50,000 or more ranked in descending order on the enrollment percent change from the 2011-12 school year to the 2015-16 school year. See the full interactive table to perform similar operations. Click graphic for larger view.
See about other demographic-economic interactive tables.
Join me in a Data Analytics Lab session to discuss more details about accessing and using wide-ranging demographic-economic data and data analytics. Learn more about using these data for areas and applications of interest.
About the Author
— Warren Glimpse is former senior Census Bureau statistician responsible for innovative data access and use operations. He is also the former associate director of the U.S. Office of Federal Statistical Policy and Standards for data access and use. He has more than 20 years of experience in the private sector developing data resources and tools for integration and analysis of geographic, demographic, economic and business data. Contact Warren. Join Warren on LinkedIn.
