Tag Archives: Collin County

New Residential Construction by County

.. what’s happening in the north Dallas metro? .. a lot, take a look at the patterns of new residential construction for Collin and Denton counties using data and tools presented in this section. Examine new residential construction, leading economic indicator, for counties and regions of interest to you anywhere in the U.S. Use of the Regional Demographic-Economic Modeling System (RDEMS) to examine patterns of residential construction in context of related wide-ranging, multi-sourced data.

This section provides a summary of new housing units authorized by building permits for new residential construction for each/all counties. Use data analytics tools and data described here analyze these data and related housing issues.
• interactive data analytics – details/access
• use GIS project/datasets – details/access
• access individual county profiles – details/access

Patterns of New Authorized Residential Units by County
The following graphic shows the 2015 per capita value of total units authorized by county. The four largest Texas metros are shown with bold brown boundaries.
See about subject matter included in datasets.

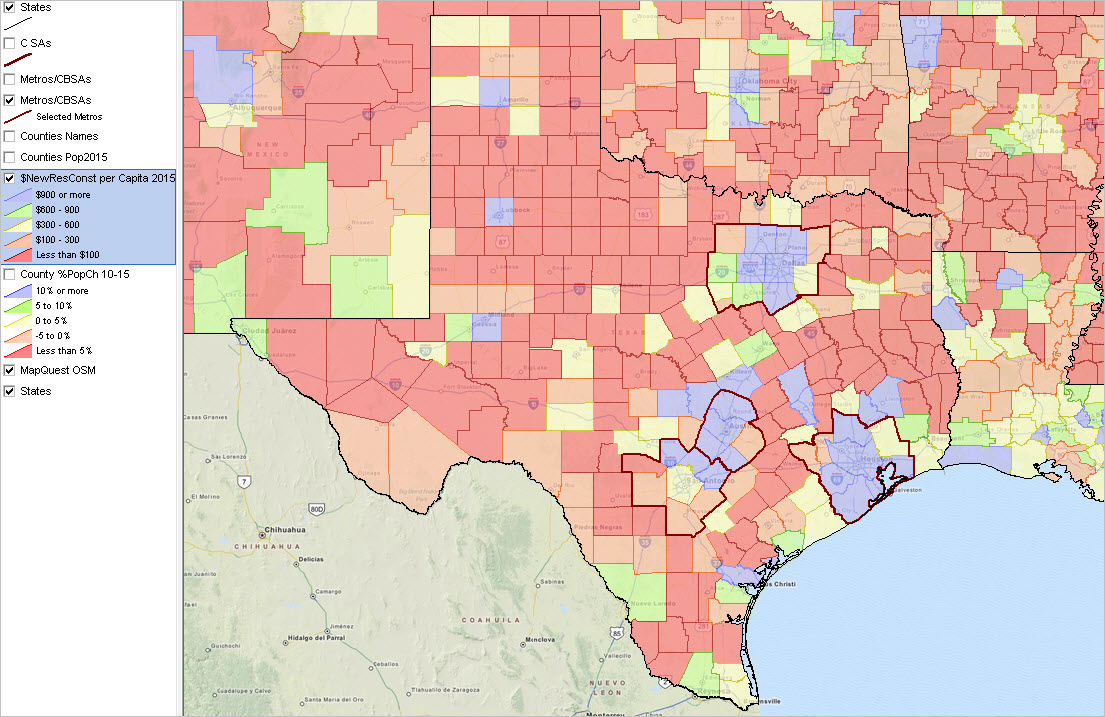
View created with CV XE GIS. Click graphic for larger view.

Additional views with counties labeled with name, 2015 housing units and 2015 total new housing units authorized.
Charlotte, NC-SC metro by county
Dallas, TX metro by county
Houston, TX metro by county

Leading Economic Indicator
Building permit data (housing units authorized by building permits for new residential construction) are economic leading indicators. Investors and housing developers use these data to examine the characteristics and trends in new residential housing development. The short time lag between the data reference date and data access date, 1-2 months, makes this set of indicators important in assessing the current situation and patterns during the past year or more. The national scope coverage and geographic granularity (state, metro, county and city) enable comparison among types of areas and peer groups. Finance and real estate professional and researchers examine building permit patterns to develop strategic insights. Government and policy makers use these data to get a pulse on markets and changing patterns to administer programs and operations. See more about these data below in this section.

New residential construction begins with building permits. Overall U.S. housing starts are approximately 2.5% less than permits issued (22.5% less for multi-family units). Completions are approximately 4% less than starts (7.5% less for multi-family units). During the past year-plus, “residential fixed investment” has been approximately $500 billion and remained steady at 3.1% of real Gross Domestic Product.

Access Individual County Profiles
The following graphic illustrates use of the Regional Demographic-Economic Modeling System (RDEMS) to access the HSG1 Housing Units & New Residential Construction tables for a selected county. Click graphic for larger view.

Mecklenburg County, NC [37119] located in the Charlotte, NC-SC metro

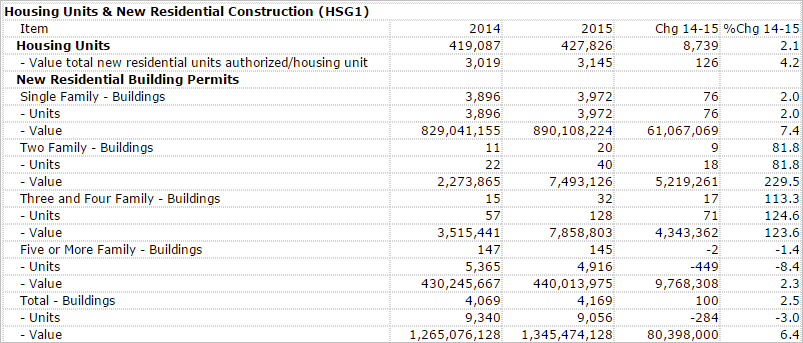
Add a link to your Web page for areas of interest: The URL structure for Mecklenburg County is:
http://proximityone.com/rdems/1/rdems37119hsg1.htm
– more in general, substitute the county state+county FIPS code (37119 in this case) to access a county of interest.

Using the Interactive Table
The interactive table includes a row for each county. Column structure and content are described below the table.
• Click the StCty link to view the housing unit/new construction profile.
• Select a metro to examine component counties

The following graphic illustrtaes use of the table to examine characteristics of the Dallas metro counties. Click graphic for larger view.

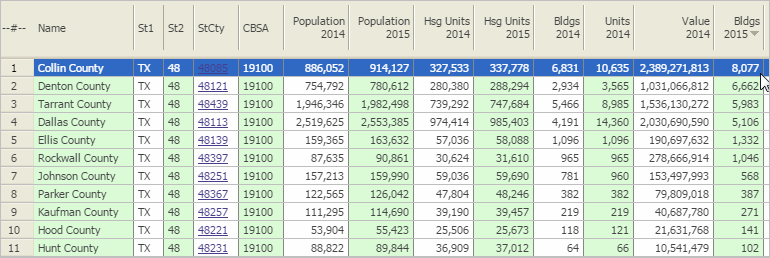
Join me in a Data Analytics Lab session to discuss more details about accessing and using wide-ranging demographic-economic data and data analytics. Learn more about using these data for areas and applications of interest.

About the Author
— Warren Glimpse is former senior Census Bureau statistician responsible for innovative data access and use operations. He is also the former associate director of the U.S. Office of Federal Statistical Policy and Standards for data access and use. He has more than 20 years of experience in the private sector developing data resources and tools for integration and analysis of geographic, demographic, economic and business data. Contact Warren. Join Warren on LinkedIn.

Evolution of Census Tracts: 1970-2010

… examining statistical area geographic change … in the world of small area demographic-economic data analysis, census tracts are often a preferred level of geography. Subdivisions of counties (or county equivalent), census tracts cover the U.S. from wall-to-wall. Each county is comprised of one or more census tracts. Averaging 1,200 population, tract geography often corresponds to neighborhood areas. For Census 2010, there were 73,057 census tracts defined. Their reasonably static geography between each decennial census is an important feature for many applications. See related more detailed Web section

Annual census tract demographic-economic updates from the American Community Survey 5-year estimates (ACS0913), make census tracts even more appealing. But it has not always been that way. And, longitudinal comparison of demographic-economic change at the tract level can be challenging where tract geography and codes change with a new decennial census.

2010 marked the 100th anniversary of the census tract. Extensive use of the census tract started with the 1970 census and has evolved since then. This section illustrates how census tracts evolved between 1970 and 2010 using GIS resources. A GIS project was developed that includes census tract shapefiles for each census 1970 through 2010.

Visualizing Demographic Patterns by Census Tract
The following graphic shows patterns of economic prosperity by Census 2010 census tract in the Dallas, Texas metro area (Dallas metro component counties & demographic change). Census tract geography and demographic patterns are reviewed for part of Collin County. The following view shows median household income (MHI), based on ACS 2013 5-year estimates, by census tract. See MHI intervals/colors in legend at left of map. Boundaries/patterns are shown for Census 2010 tracts “0316.??” (black boundaries) in context of 1970 census tract “031600”. Historical views of this area, illustrating how tract boundaries have changed over time, are shown later in this section.

– Click graphic for larger view showing Census 2010 tract codes.
– View developed with CV XE GIS.
Click to view tract area (red boundaries) in context of broader region

1970 Census Tracts
A very small part of the U.S. was covered by 1970 census tracts.
The following view shows 1970 census tracts with orange fill pattern.

  View developed with CV XE GIS.

1980 Census Tracts
A larger part of the U.S. was covered by 1980 census tracts. The following view shows 1980 census tracts with orange fill pattern.

  View developed with CV XE GIS.

A Brief History
Initial census tract data was with the 1910 census and included a handful of cities. Starting with the 1940 census, census tracts became an official statistical geography tabulation area. Starting with the 1970 census, and the first more extensive data in machine-readable form (magnetic tapes used with mainframe computers), census tracts became a more popular geography for the analysis of small area data. For both the 1970 and 1980 censuses, census tracts did not fully cover the U.S. For the 1990 census, census tracts and the quasi-equivalent “block numbering areas” (BNAs) covered the U.S. wall-to-wall. Starting with Census 2000, BNAs were retired and transformed into census tracts. Use of census tracts for demographic-economic analysis has continued gain in popularity. Now, census tract estimates are available annually from the American Community Survey 5-year estimates (ACS0913). Access ACS 5-year estimates via interactive tables.

1970 Census Tracts: Collin County; Dallas Metro
1970 census tract “031600” shown with bold black boundary.

  View developed with CV XE GIS.

1980 Census Tracts: Collin County; Dallas Metro
1980 census tracts 0316.?? (same general geography as covered by tract “031600” in 1970) shown with bold black boundary. This view shows tracts labeled with the 6-character census tract code, unique within county.

  View developed with CV XE GIS.

1990 Census Tracts: Collin County; Dallas Metro
1990 census tracts 0316.?? (same general geography as covered by tract “031600” in 1970) shown with bold black boundary. This view shows tracts labeled with the census tract “base” plus “suffix” code separated by a decimal point. In 1980, note that there is no 1130.01 or 1130.02 as shown above for the 1970 vintage tracts . The codes 1130.03 and 113003 are equivalent. The 6-character, no decimal version, is preferred in all cases when used as a geocode.


  View developed with CV XE GIS.

2000 Census Tracts: Collin County; Dallas Metro
2000 census tracts 0316.?? (same general geography as covered by tract “031600” in 1970) shown with bold black boundary.

  View developed with CV XE GIS.

2010 Census Tracts: Collin County; Dallas Metro
2010 census tracts 0316.?? (same general geography as covered by tract “031600” in 1970) shown with bold black boundary.

  View developed with CV XE GIS.

Equivalencing Census 2000 and Census 2010 Tract Geography
As shown above, the area covered by Census 2000 tracts 1130.15 and 1130.18 become Census 2010 tract 1146.00. Comparing the above map views for Census 2000 and Census 2010 shows (upper left tracts) shows Census 2000 tract 031644 is split into Census 2010 tracts 031656, 031657 and 031658. To compare demographic change for Census 2000 tract 031644 requires combining data tabulated for Census 2010 tracts 031656, 031657, 031658 and other partial Census 2010 tracts intersecting with Census 2000 tract 031644. See more about these relationships at Census 2010 Demographics for Census 2000 Geography. Use the interactive table in that section to view the relationship among these tracts. The graphic shown below illustrates use of that table. A query has been placed on Census 2000 tract 031644 (see button below table and query value 48085031644). The table nowe shows rows only for Census 2000 031644. See the corresponding Census 2010 tracts in columns to right.

The following graphic shows the relationship between these tracts.

To replicate this view in the interactive table, follow these steps:
• Click ShowAll button below table.
• Key in Census 2000 tract code 48085031644 to right of Find in GeoID00 button.
• Click Find in GeoID00 button.
• The view above appears in the table.

About the Author
— Warren Glimpse is former senior Census Bureau statistician responsible for innovative data access and use operations. He is also the former associate director of the U.S. Office of Federal Statistical Policy and Standards for data access and use. He has more than 20 years of experience in the private sector developing data resources and tools for integration and analysis of geographic, demographic, economic and business data.