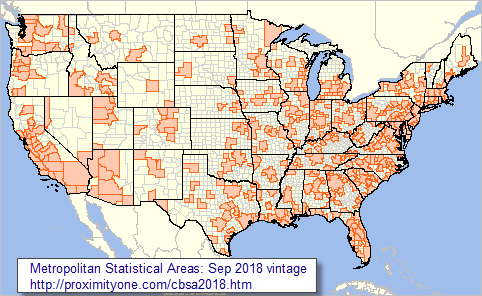
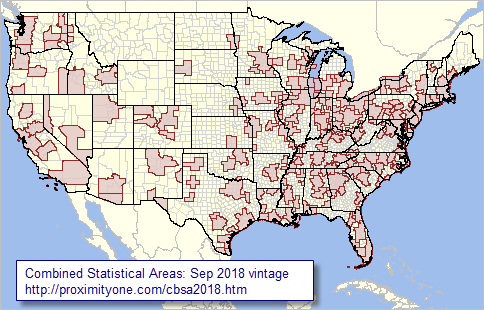
.. metropolitan areas are referred to as CBSAs (Core-Based Statistical Areas) and formally defined as sets of contiguous counties for the Federal Statistical System by OMB based largely on Census Bureau data. More than 93-percent of the U.S. population live in CBSAs. This post presents three map graphics showing the geographic configuration of CBSAs and related CSAs (Combined Statistical Areas) — groupings of contiguous CBSAs that meet certain criteria. See related Web section for more detail.
The graphics below use the September 2018 CBSA vintage, the current and likely to be used for Census 2020 tabulations. These CBSAs are comprised of 392 Metropolitan Statistical Areas (MSAs), 384 MSAs in the U.S. and 8 in Puerto Rico, and 546 Micropolitan Statistical Areas (MISAs), 542 in the U.S. and 4 in Puerto Rico. For those MSAs that qualify, 11 MSAs are subdivided into 31 Metropolitan Divisions (MDs).
Metro Demographic-Economic Insights. What are the demographic characteristics of metros, how are they changing? We have developed annual population and population components of change estimates for the September 2018 vintage CBSAs. Access these data in this interactive table. View CBSA county components. These data are integrated with other data to develop wide-ranging demographic-economic current estimates and projections for CBSAs and other geography (Situation & Outlook).
Metropolitan Statistical Areas, Sep 2018 Vintage
The following graphic shows the 2018 vintage Metropolitan Statistical Areas (MSAs). Use the associated GIS project to examine different years or subject matter items. Click graphic for larger view showing combined MSAs and MISAs.
Expand browser window for best quality view.

.. view developed with ProximityOne CV XE GIS and related GIS project.
.. create other views, geospatially analyze your data with associated GIS project.
Micropolitan Statistical Areas, Sep 2018 Vintage
The following graphic shows the 2018 vintage Micropolitan Statistical Areas (MISAs). Use the associated GIS project to examine different years or subject matter items. Click graphic for larger view showing combined MSAs and MISAs. Expand browser window for best quality view.

.. view developed with ProximityOne CV XE GIS and related GIS project.
.. create other views, geospatially analyze your data with associated GIS project.
Combined Statistical Areas, Sep 2018 Vintage
The following graphic shows the 2018 vintage Combined Statistical Areas (CSAs).
CSAs are contiguous CBSAs that are combined to form a CSA when certain conditions are met. Use the associated GIS project to examine different years or subject matter items. Click graphic for larger view showing CSAs with county overlay (visually determining which counties are in a CSA). Expand browser window for best quality view.

.. view developed with ProximityOne CV XE GIS and related GIS project.
.. create other views, geospatially analyze your data with associated GIS project.
DemographicEconomic Analytics Web Sessions
Join me in a Demographics Analytics Lab session to discuss more details about accessing and using wide-ranging demographic-economic data and data analytics. Learn more about using these data for areas and applications of interest.
About the Author
— Warren Glimpse is former senior Census Bureau statistician responsible for innovative data access and use operations. He is also the former associate director of the U.S. Office of Federal Statistical Policy and Standards for data access and use. He has more than 20 years of experience in the private sector developing data resources and tools for integration and analysis of geographic, demographic, economic and business data. Contact Warren. Join Warren on LinkedIn.
