
… examining characteristics, patterns and change for the Dallas-Fort Worth-Arlington, TX metropolitan area … the total population of the metro changed from 6,452,725 in 2010 to 6,954,330 in 2014, a change of 501,605 (7.77%). Among all 917 metros, this metro was ranked number 4 in 2010 and 4 in 2014, based on total population …
• How will the market for single family homes change over the next 5 years?
• How does economic prosperity in this metro compare to others?
• What are the patterns in metro rental income and rental vacancy rates?
• How do patterns vary within the metro by county/neighborhood?
• How are demographic-economic characteristics trending?
We examine these types of topics in this section. Stakeholders can replicate applications reviewed here for this and other metros. Select any metro.
.. this section now continuously updated … see Dallas Metro Situation & Outlook; see related Texas Demographic-Economic Characteristics.
Metropolitan areas include approximately 94 percent of the U.S. population — 85 percent in metropolitan statistical areas (MSAs) and 9 percent in micropolitan statistical areas (MISAs). Of 3,143 counties in the United States, 1,167 are in the 381 MSAs in the U.S. and 641 counties are in the 536 MISAs (1,335 counties are in non-metro areas).
Focus on Dallas-Fort Worth-Arlington, TX MSA
This section is focused on the Dallas-Fort Worth-Arlington, TX MSA; Core-Based Statistical Area (CBSA) 19100. It is not intended to be a study of the metro but rather review recent and trending decision-making data that can be brought together to examine patterns and change and develop insights. The data, tools and methods can be applied to any metro.
– See a more detailed version of this document focused on this metro.
The Dallas-Fort Worth-Arlington, TX MSA is shown in the graphic below. The 7-county metropolitan statistical area is shown with bold boundary; counties appear with black boundaries and county name/geographic code labels.
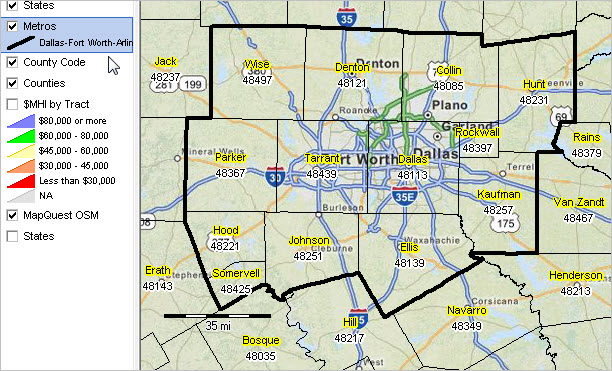
Click graphic for larger view and details. Map developed using CV XE GIS.
Patterns of Economic Prosperity by Neighborhood
Median household income by census tract

Click graphic for larger view and map legend. Map developed using CV XE GIS.
Develop variations of this map view using the Mapping Texas Neighborhood Patterns GIS resources.
Fortune 1000 Companies
This metro is home to 40 Fortune 1000 companies including AT&T, American Airlines, Comerica, Dean Foods, Exxon Mobil, Fluor Corporation, J.C. Penney, Kimberly-Clark, Lennox International, Michaels Stores, Neiman Marcus, RadioShack, Southwest Airlines, Tenet Healthcare and many others.
Principal Cities
Metro principal cities (about principal cities) … click the link to view city profile Arlington .. Dallas .. Denton .. Fort Worth .. Irving .. Plano .. Richardson
Overview of Selected Demographic-Economic Characteristics
The total population of the Dallas-Fort Worth-Arlington, TX metro changed from 6,452,725 in 2010 to 6,954,330 in 2014, a change of 501,605 (7.77%). Among all 917 metros, this metro was ranked number 4 in 2010 and 4 in 2014, based on total population. Annual net migration was 62,320 (2011), 77,089 (2012), 57,645 (2013), 74,176 (2014). View annual population estimates and components of change table.
This metro is projected to have a total population in 2020 of 7,418,541. The projected population change from 2010 to 2020 is 965,816 (15.0%). The population ages 65 years and over is projected to change from 592,695 (2010) to 1,031,937 (2020), a change of 439,242 (74.1%). See more about population projections.
Based on per capita personal income (PCPI), this metro was ranked number 61 in 2008 and 76 in 2014. among the 917 metros for which personal income was estimated.The PCPI changed from $44,697 in 2008 to $49,506 in 2014, a change of $4,809 (10.8%). Per capita personal income (PCPI) is a comprehensive measure of individual economic well-being. Use the interactive table to compare PCPI in this metro to other metros.
282 metropolitan statistical areas, of the total 381, experienced an increase in real Gross Domestic Product (GDP) between 2009 and 2014. This metro ranked number 5 among the 381 metros based on 2014 GDP. The GDP (millions of current dollars) changed from $355,756 in 2009 to $504,358 in 2014 a change of $148,602 (41.77%). Real GDP (millions of real, inflation adjusted, dollars) changed from $355,756 in 2009 to $460,154 in 2014, a change of $104,398 (29.35%). GDP is the most comprehensive measure of metro economic activity. GDP is the sum of the GDP originating in all industries in the metro.
View additional selected details about the metro …
Population Characteristics & Trends
– Component City Characteristics
– Component County Characteristics
– General Demographic Characteristics
Housing Characteristics & Trends
– Total Housing Units
– General Housing Characteristics
– Residential Construction; Housing Units Authorized & Value
– Housing Price Index
Economic Characteristics & Trends
– Economic Profile
– Gross Domestic Product
– Establishments, Employment & Earnings by Type of Business
– Labor Market Characteristics & Trends
Education Infrastructure
– Component School District Characteristics
– Component Higher Education Institution Characteristics
Weekly Data Analytics Lab Sessions
Join me in a Data Analytics Lab session to discuss more details about this metro, comparing this metro to peer group metros and use of data analytics to develop further detail related to your situation.
About the Author
— Warren Glimpse is former senior Census Bureau statistician responsible for innovative data access and use operations. He is also the former associate director of the U.S. Office of Federal Statistical Policy and Standards for data access and use. He has more than 20 years of experience in the private sector developing data resources and tools for integration and analysis of geographic, demographic, economic and business data. Contact Warren. Join Warren on LinkedIn.


