
Understanding the size, characteristics and distribution of the Asian population is important to Asian community stakeholders as well as business, government and organizations that cater to Asian population interests. The Asian population is distributed unevenly throughout the U.S. As of Census 2010, and among Metropolitan Statistical Areas (MSAs), the Asian Indian population ranged from a high of 6.6 percent of the total population in the Yuba City, CA MSA to just 44 persons in Farmington, NM MSA. The New York MSA has the largest number of Asian Indians (526,133). Examine the Asian population distribution by type and metro using this interactive table. See more about Asian race groups.
This section reviews use of tools, data and related resources to examine the distribution of the Asian population by ZIP code area and in context of urban/rural geography. Create your own map views similar to those shown in this section. Zoom to locations of interest. Modify Asian percent population settings. Label ZIP codes areas in your preferred manner. Add your own related data. See details below.
Asian Population by ZIP Code & Urban/Rural Status
Patterns of percent Asian population by ZIP Code in Houston, TX area are shown in the graphic presented below. The map shows ZIP code areas that have certain percentages of population who are Asian. The orange fill pattern shows urban areas (defined by census block). Areas with no orange fill pattern are rural blocks. See legend at the left of map for details.
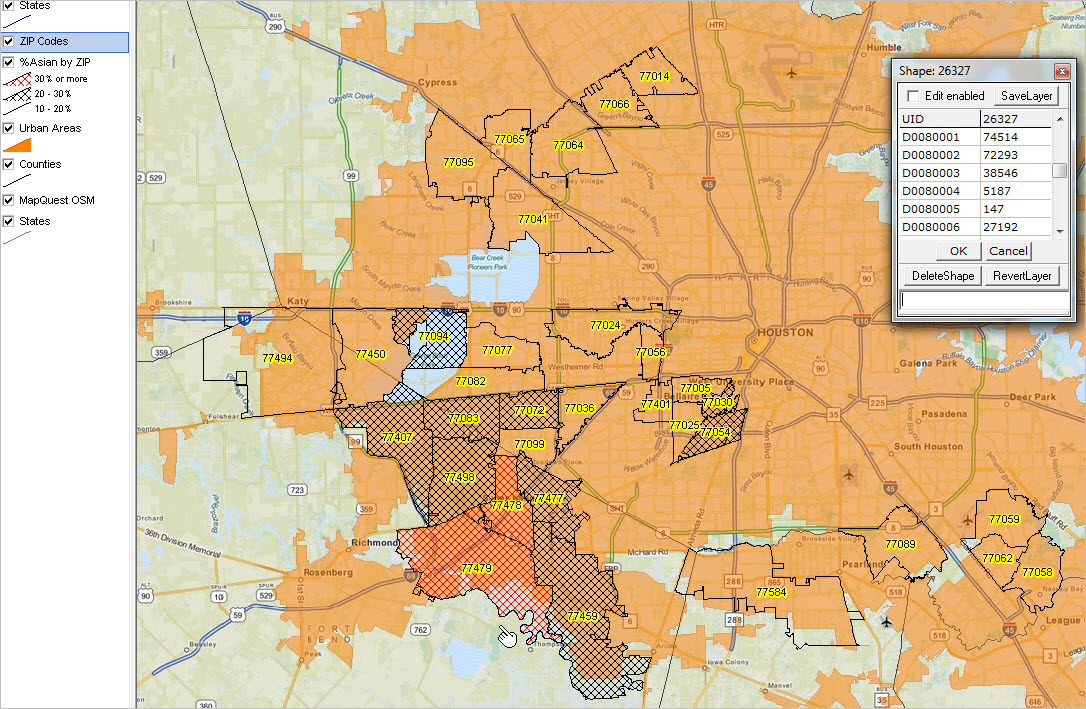
ZIP code areas with highest percent Asian population (see pointer) are shown with red crosshatch pattern.
• Click graphic for larger view, zoom-in & ZIP Codes as labels.
• Click this link to view zoom-in, isolating ZIPs with 30% or more Asian.
Other Selected Areas …
Atlanta Area: Asian Population by ZIP Code & Urban/Rural Status
Orange fill pattern shows urban areas.
See ZIP code area legend in map view at top of section.

Washington DC: Asian Population by ZIP Code & Urban/Rural Status
Orange fill pattern shows urban areas.
See ZIP code area legend in map view at top of section.

New York City: Asian Population by ZIP Code & Urban/Rural Status
Orange fill pattern shows urban areas.
See ZIP code area legend in map view at top of section.

San Francisco: Asian Population by ZIP Code & Urban/Rural Status
Orange fill pattern shows urban areas.
See ZIP code area legend in map view at top of section.

Los Angeles: Asian Population by ZIP Code & Urban/Rural Status
Orange fill pattern shows urban areas.
See ZIP code area legend in map view at top of section.

Using these Resources on Your Computer
Members of the ProximityOne User Group may use the CV XE GIS software and associated GIS project to develop map views like those shown in this section. Join now. No fees.
Support & DMI Web Sessions
Learn more about using resources described in this section. Join us in a Decision-Making Information Web session. There is no fee for these one-hour Web sessions. Each informal session is focused on a specific topic. The open structure also provides for Q&A and discussion of application issues of interest to participants. We can address specific questions about tools to visually analyze patterns.
